Case-study data
What is the ideal stocking rate on a pasture based dairy farm? This question has caused numerous unresolved debates. There are many contradictory opinions, backed by data, about whether to aim for a higher or lower stocking rate. I used data from the Trace & Save database to gather further insight looking at 91 farms from 2012 – 2021. Some farms participating with Trace & Save for all nine years, with other farms only participating since 2021. This gave a total of 373 observations, with an observation being a farm’s data for a year. I removed all the farms which do not raise their heifers on-farm, to ensure better comparability between similar farm systems. This left me with 316 observations to work with.
If anyone is interested in knowing exactly what each measure entails, you can see the case-study which Trace & Save published with WWF and Nedbank in 2021, where similar measures were used (Making a business case for sustainable dairy production).
Broad analysis
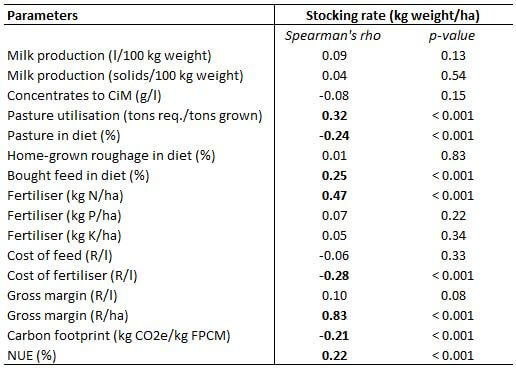
To start trying to understand stocking rate on pasture-based dairy farms I used total liveweight of animals (kg’s of cows in milk, dry cows and heifers) per total hectare of land on the farm (irrigated pastures, drylands and lands used to grow roughage), i.e. kg LW/ha as the main measure of stocking rate. Using various indicators of productivity, profitability, and sustainability I found some insightful significant correlations with stocking rate. What I found was that higher stocking rates are associated with (see Table 4 for actual results):
- higher nitrogen fertiliser application rates (kg N/ha)
- lower costs of NPK fertiliser per litre (R/l)
- lower proportion of pasture in the overall farm diet and higher proportion of bought feed (% contribution)
- higher pasture utilisation, in terms of pasture required based on a back-calculation as a percentage of pasture grown (tons req./tons grown)
- higher gross margin per hectare (R/ha)
- lower carbon footprint (kg CO2e/kg FPCM)
- higher nitrogen use efficiency (%)
Figure 1: An example of one of the advantages of higher stocking rate is the positive correlation with higher gross margin
At first glance, this would clinch the argument that a higher stocking rate is better. It shows that, on average, a low stocking rate is less profitable per hectare and results in a higher environmental impact. But there are still a lot of questions in terms of how high the stock rate should therefore be? Surely there is a point where stocking rate is too high?
Refining the data
To try and understand the dynamics around stocking rate better I decided to refine the dataset further. I removed all the farms where there was home-grown roughage, and where there were areas on the farm which are not pastures. Although these farms are important to understand, I wanted to see what we could learn from farms which are predominantly pastures, because they are more directly comparable to each other. This left me with 176 observations.
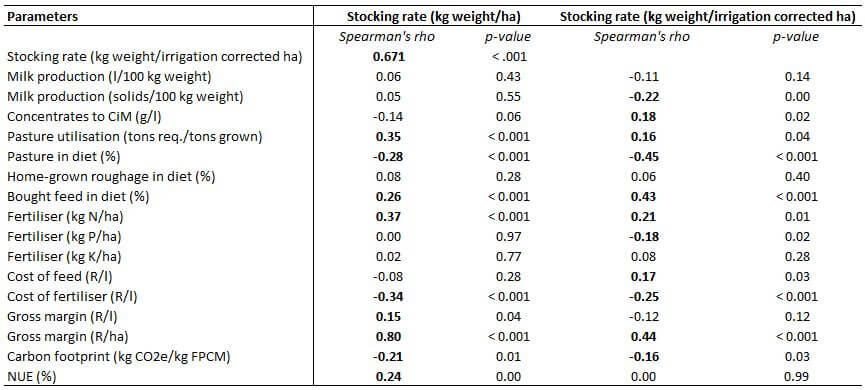
Using this refined data set, I found that higher stocking rates per total hectare are associated with (see Table 5 for actual results):
- all the same results as the analysis above, therefore showing that the trend discussed above is true even when we use a smaller dataset with more directly compared farm systems
- higher gross margin per litre, which was not found with the previous data set
These results further strengthen the argument for a higher stocking rate being better.
One of the factors that could skew these results is that farms which are able to have a higher stocking rate are the ones which have more irrigated areas. When looking at the results in terms of stocking rate per irrigation corrected hectare. To overcome this bias I added another measure of stocking rate – total liveweight per irrigation corrected hectare. I did this by counting each irrigated hectare as one hectare, and each dryland hectare as half a hectare. Using the irrigation corrected stocking rate, I found that higher stocking rates are associated with (see Table 5 for actual results):
- all the same results as in the previous two analyses, except for nitrogen use efficiency, which was not correlated with stocking rate, and as with the first analysis, gross margin per litre was not correlated with stocking rate
- lower production of milk solids (kg solids/100 kg weight)
- higher concentrates fed to the cows in milk per litre of milk (g/l)
- lower phosphorous fertiliser application rates (kg P/ha)
- higher cost of feed (R/l)
Figure 2: An example of a disadvantage of higher stocking rates is the negative correlation with pasture utilisation.
These results are indicative of the stocking rate dilemma being a little bit more complicated than purely a higher stocking rate is better. The results still point towards a higher stocking rate being more profitable, but it also shows a higher cost to milk production. Many people might say that doesn’t matter because it is still more profitable, but a higher cost of production is a dangerous path in the long term because it means more risk of exposure to inflation. This is a big reality in South Africa and must be taken into consideration when deciding on the most sustainable farm system for the future.
The role of pasture
I decided to explore this dilemma further. A seemingly clear assumption is that the lower the stocking rate, the more pasture there will be available for each animal on the farm. This should mean greater profitability. But is this the case? It seems a bit more complicated than that in view of the data which has been presented in this case study.
I decided to calculate a figure for how much pasture there is grown and therefore available for each animal – kilogram of pasture per kilogram of liveweight on the farm. I wanted to see how this figure correlated with the other parameters. The more pasture there is available per animal the (see Table 6 for actual results):
- lower the stocking rate, both in terms of total hectares (kg weight/ha), and in terms of irrigation corrected hectares (kg weight/irrigation corrected ha)
- higher the milk solids (kg solids/100 kg weight)
- lower concentrates fed to the cows in milk per litre of milk (g/l)
- lower pasture utilisation (tons req./tons grown)
- higher proportion of pasture in the overall farm diet and lower proportion of bought and home-grown feed (% contribution)
- lower N application rate (kg N/ha)
- lower cost of feed (R/l)
- higher cost of fertiliser (R/l)
- higher gross margin per litre (R/l)
- lower gross margin per hectare (R/ha)
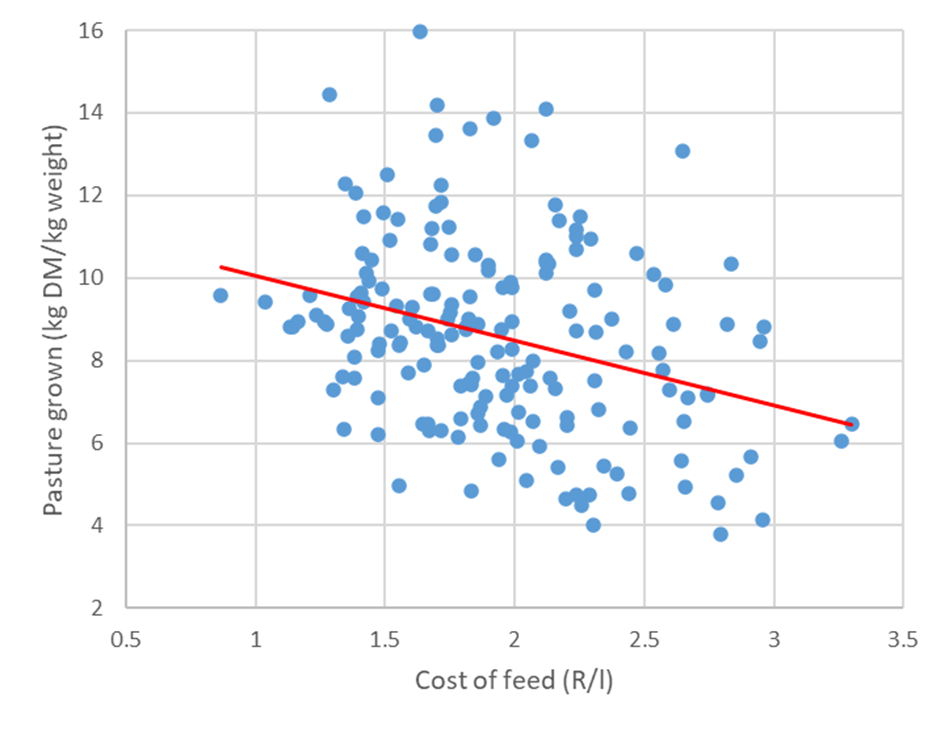
Figure 3: An important reason to provide as much pasture per cow as possible is that it is associated with a lower cost of feed per litre produced.
These results are the epitome of why this conversation is so complex. Having a higher amount of pasture available per cow has obvious advantages. Especially in terms of limiting the total cost of production. But two of the results – lower pasture utilisation and lower gross margin per hectare are problematic.
The relationship with stocking rate can be seen here. A higher stocking rate gives you less pasture per animal, but it results in a better pasture utilisation. In other words, although there is a lot of pasture available at the lower stocking rate, a lot of this pasture is wasted. The higher stocking rate also means more feed must be brought onto the farm, at a cost, but it results in a higher gross margin per hectare.
Is there an ideal stocking rate?
Although correlations using a large dataset are insightful and can teach us a lot about the relationship between various factors making up a farm system, it does not always provide absolute clarity on what the best system is. The data we have looked at so far points towards a higher stocking rate being better across most measures, but is there a specific stocking rate which is ideal?
To further explore this question, let’s look at specific farm systems. Since the data so far has indicated that a higher stocking rate is better, I thought to compare all the parameters we have been looking at between the observations with the highest stocking rate (top 33% or top 58 farms) with the rest of the farms with a lower stocking rate. I used the smaller, 176 farm, dataset, since these farms are more directly comparable to each other.
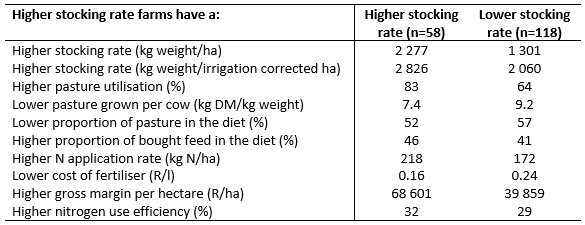
Table 1: The results of this Mann-Whitney U test comparison contrasting the farms with a higher stocking rate to the lower stocking rate farms (see Table 7 for actual results)
These results follow a very similar trend to those shown by the correlation data, but it is interesting to see the actual numbers for each parameter. The advantage of higher stocking rate is re-emphasised here with the higher pasture utilisation, but there is still the disadvantage of lower pasture per cow and lower pasture in the diet. There is also the disadvantage of a higher nitrogen application rate, but the overall cost of fertiliser per litre is lower than the rest of the farms. Only the gross margin per hectare is higher on the higher stocking rate farms, not the gross margin per litre, so there is still the issue of exposure to the risk of inflation. The biggest reason for this is the high feed that is still being relied upon on these farms.
The holistic, sustainable farm system
I have one more step to explore in this data, since just looking at the highest stocking rate farms did not yield much extra insight. Once again using the smaller 176 farm dataset, I used four measures to rank farms: gross margin per litre; gross margin per hectare; carbon footprint; and nitrogen use efficiency. I ranked all the observations from 1-176 for each measure. Then I looked at which observations were in the top third (i.e. top 33%) in all four categories. This resulted in 15 observations (out of interest from 10 different farms) of farms which I would argue are the most sustainable based on overall measures. Hence, they are the farms we should be looking to as examples of an ideal system.
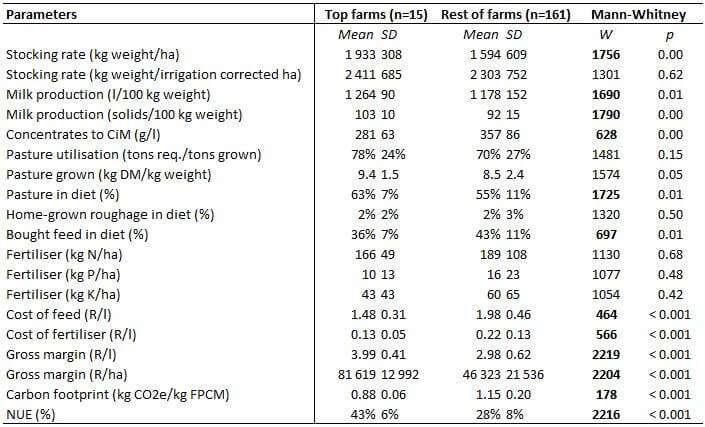
Using these 15 observations I wanted to see if there was anything to learn from their stocking rates, and other parameters. So I compared the average of all the parameters we have been looking at between these 15 observations and the other 161 observations (using a Mann-Whitney U test). The best performing farms were distinct from the other farms (see Table 8 for actual results).
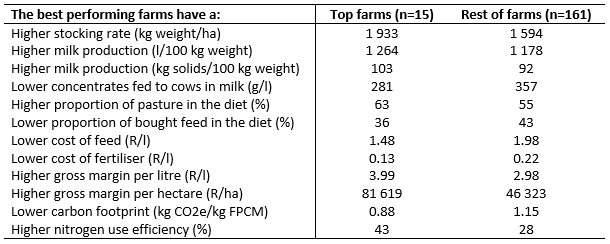
Table 2: Significant differences in sustainability parameters between top performing farms and rest of farms
Some of the other differences which are not statistically significant, but are still important to point out since any farmer would recognise that these results are meaningful, are presented in the table 3 below.
Table 3: Other notable differences in sustainability parameters between top performing farms and rest of farms
I find these results to be fascinating in our quest to understand stocking rate better. Other than higher stocking rates, there are some very important additional aspects of their farms. Although the stocking rates of these farms are higher than the rest of farms, their stocking rate is nowhere close to as high as the highest stocking rate farms in the previous analysis (i.e. 1 933 vs 2 277 kg weight/ha). And the stocking rate per irrigation corrected hectare, although higher, was not statistically significantly higher on these top performing farms. Chasing the highest possible stocking rate is not the answer. Too low of a stocking rate is an obvious problem, but so too is too high of a stocking rate.
One of the distinct advantages of a higher stocking rate throughout this case study has been that a higher stocking rate is associated with a higher gross margin per hectare. These 15 observations show that a more balanced approach blows a high stocking rate out of the water. These farms had an average gross margin of R81 619 R/ha, whereas the average for the highest stocking rate farms was R68 601. And these top performing farms had a much higher gross margin per litre as well.
The important things that these top performing farms were able to achieve, which are different to the highest stocking rate farms, are a combination of:
- Optimal milk production – better milk production per weight and higher solids per weight are important aspects of a sustainable dairy farm. Since these are not correlated with stocking, they are independent of the stocking rate and are therefore an important distinguishing factor on top performing farms.
- Better feed conversion in terms of lower concentrates, lower proportion of bought feed, higher pasture utilisation and lower cost of feed. This is also a different balance than what is found with high stocking rates. This means these farms buck the trend of less pasture with higher stocking rates, which allows them to get away with less bought feed and hence a lower cost of feed. This is such an important distinction. The danger of too high stocking rate is too high cost of bought feed. Farmers must figure out how to strike this balance on their farms – it is not straightforward and takes a high level of management to get right.
- Lower fertiliser costs, with a lower nitrogen application rate. The lower cost of fertiliser is consistent with a high stocking rate, since even high N application rate per hectare are diluted by high milk production per hectare on these farms. What is distinct about the top performing farms is that they achieved an even lower cost of fertiliser per litre by having a lower N application rate than the other farms. This can only be achieved through improved soil health, which has been discussed in detail in the WWF-Nedbank case study mentioned earlier.
Conclusion
These findings make it clear to me that there is a lot more to sustainable dairy farming than finding the perfect stocking rate. An ideal stocking rate is one which is high, but not too high. But more important than this is that a farmer can optimise milk production, achieve good feed conversion, and reduce fertiliser costs. For some of these a higher stocking rate is an advantage, for example reducing fertiliser costs and increasing pasture utilisation, but in other areas a higher stocking rate is a challenge, for example feeding less bought feed and having higher pasture intake. Therefore, every farmer should assess their system and see where they still have opportunities to improve. This will probably show them whether their stocking rate is too low, too high, or just right. The data in this case study would suggest that very few farms are in the just right category.
Tables
Table 4: Correlations between stocking rate and various profitability, productivity, and sustainability indicators using data from the Trace & Save research database on all the farms which raise heifers on the farm (n=316)
Table 5: Correlations between stocking rate and various profitability, productivity, and sustainability indicators using data from the Trace & Save research database on farms which raise heifers on the farm and do not grow any home-grown roughage, and have predominantly pasture areas (n=176)
Table 6: Correlations between pasture grown per cow and various profitability, productivity, and sustainability indicators using data from the Trace & Save research database on all the farms which raise heifers on the farm (n=316)
Table 7: Comparison of average values of various profitability, productivity, and sustainability indicators on top third of farms in terms of highest stocking rate versus the rest of the farms using data from the Trace & Save research database on farms which raise heifers on the farm and do not grow any home-grown roughage, and have predominantly pasture areas (n=176)
Table 8: Comparison of average values of various profitability, productivity, and sustainability indicators on top performing farms versus the rest of the farms using data from the Trace & Save research database on farms which raise heifers on the farm and do not grow any home-grown roughage, and have predominantly pasture areas (n=176)
- A carbon footprint assessment for pasture-based dairy farming systems in South Africa - 2024-02-07
- What progress have farms participating with Trace & Save made over the past 10 years? - 2023-09-06
- Carbon footprint reduction over time: Lessons from pasture-based dairy farms in South Africa - 2023-09-04

