A carbon footprint is a measure of the amount of greenhouse gases an individual, organization or business releases into the atmosphere over a specified period of time, normally a year. It involves recording all sources of greenhouse gases and equating these to carbon dioxide, which is a greenhouse gas, providing the total tons of carbon dioxide equivalents (CO2e) emitted by the entity over the year period. The greenhouse gases which are most commonly associated with agriculture are methane, nitrous oxide and carbon dioxide. Carbon footprints are an important tool providing insight on the environmental impact of an entity, but this case study is focussed on the role that a carbon footprint analyses can play in providing feedback to farmers on their farm productivity.
A carbon footprint provides a comprehensive overview of the inputs used on a farm, and when CO2e emissions are expressed as an amount per 1000 litres of milk produced, it provides an indication of inputs as a factor of production. All the inputs that are brought onto the farm have a CO2e cost, which is what is measured in the footprint, but also obviously have a financial cost. A reduction in greenhouse gas emissions relative to production therefore also means a decrease in cost relative to production, in other words, greater productivity.
To date Trace & Save has carried out 13 comprehensive carbon footprint analyses on farms throughout the Eastern Cape, South Africa. This provides an opportunity to observe the effect of various inputs on a farm’s carbon footprint. The carbon footprint is expressed in CO2e emissions per 1000 litres of milk produced on the farm. The 13 farms where carbon footprints have been carried out vary greatly with regards to geographic location, climate, farm and herd size, cow type and whether they have irrigation or dry land pastures, which all influence the inputs and production of the farm. Therefore it is necessary to have a method which allows for comparison of CO2e emissions between these farms, and tons of CO2e per 1000 litres milk produced is the best possible comparison which negates most of these differences. This allows us to make comparisons between farms and the impact that the inputs used on these farms had on their carbon footprints.
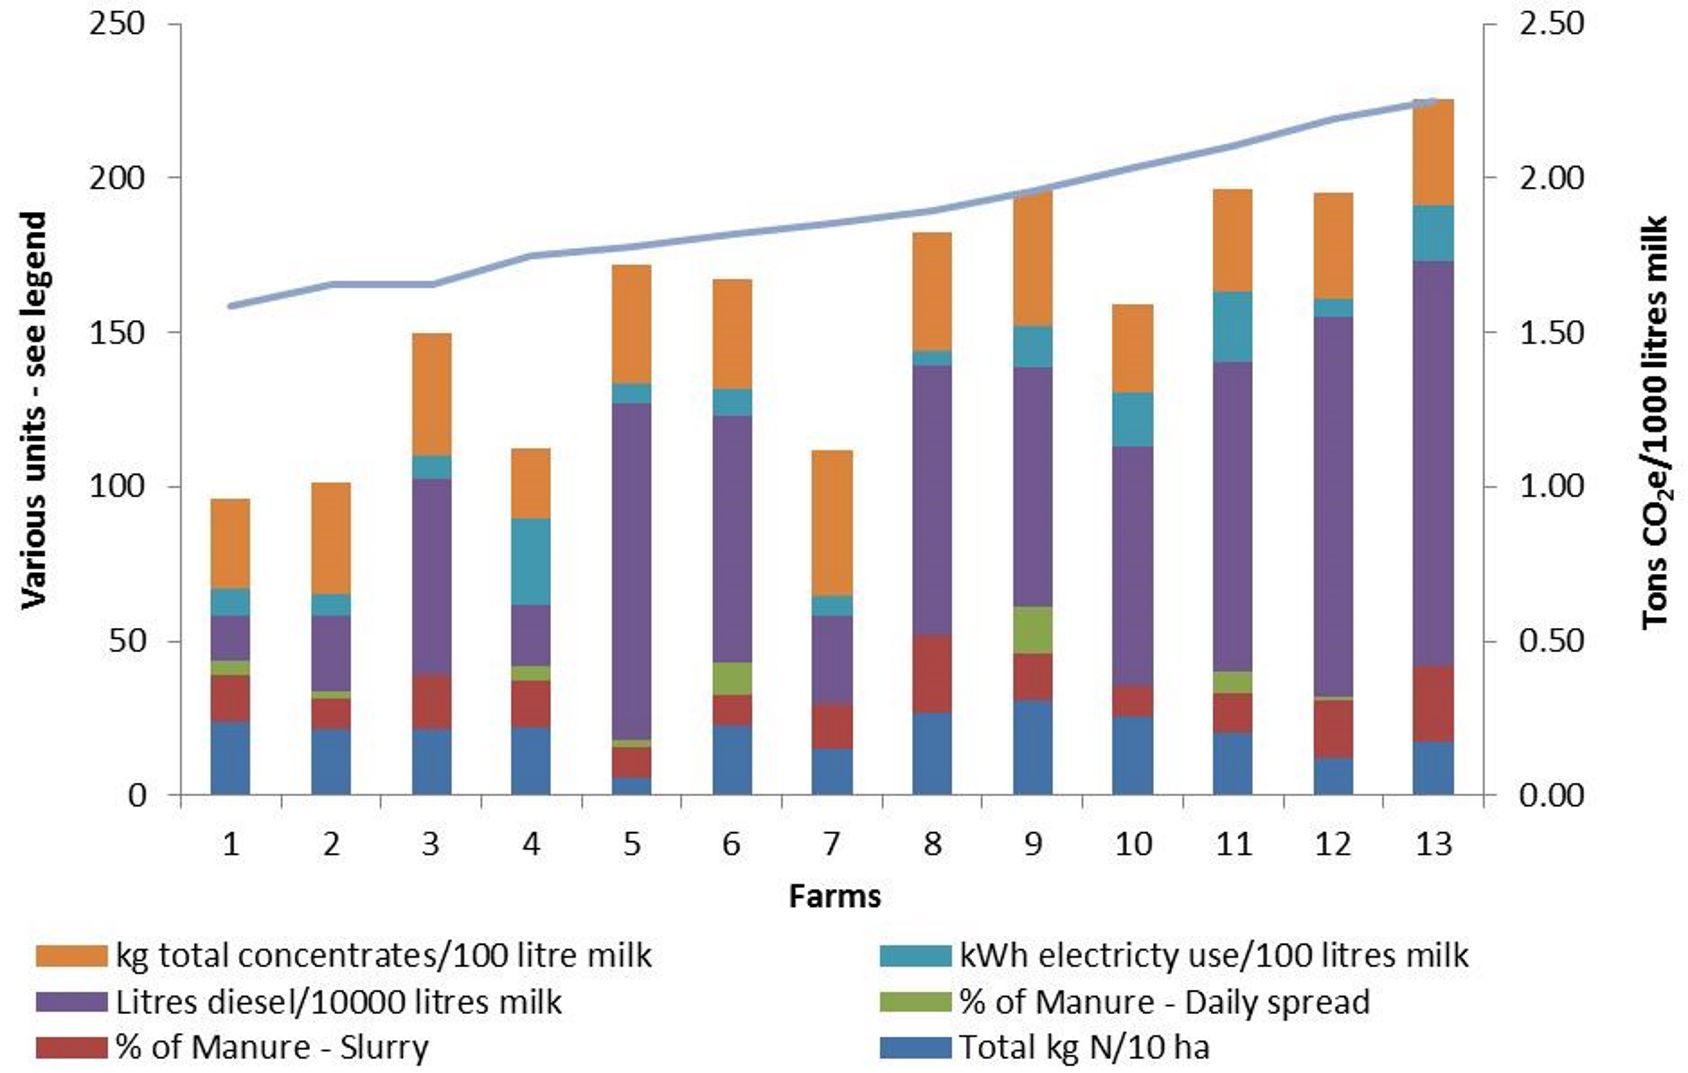
One challenge with isolating inputs and observing the impact that these inputs have on the footprint is that a footprint is based on a combination of factors. Figure 1 gives a big picture of the inputs that have been used in the rest of the figures in this case study, and the influence of the combination of inputs on the scope 1 and 2 CO2e emissions. Scope 1 emissions account for all direct emissions from sources which are owned or controlled by the farm. Scope 2 emissions account for indirect emissions as a result of the purchase of commodities whose quantities can be controlled by the farm, which is normally limited to electricity use. Not all inputs which affect scope 1 and 2 are included in this case study, as we have focussed on the things which a farmer has the most control over. Inputs which directly affect scope 3 emissions, all other indirect emissions which are a consequence of the activities of the reporting businesses, but occur from sources which are not owned or controlled by them, are not included in this case study, with the exception of diesel used by contractors which is explained later. The carbon footprint data, expressed in tons of CO2e per 1000 litres milk produced, in this case study includes all emissions from Scope 1, 2 and 3 sources, but the purpose of this case study is to explore inputs which greatly influence the footprint relative to productivity on the farm, especially focussing on inputs which a farmer has control over.
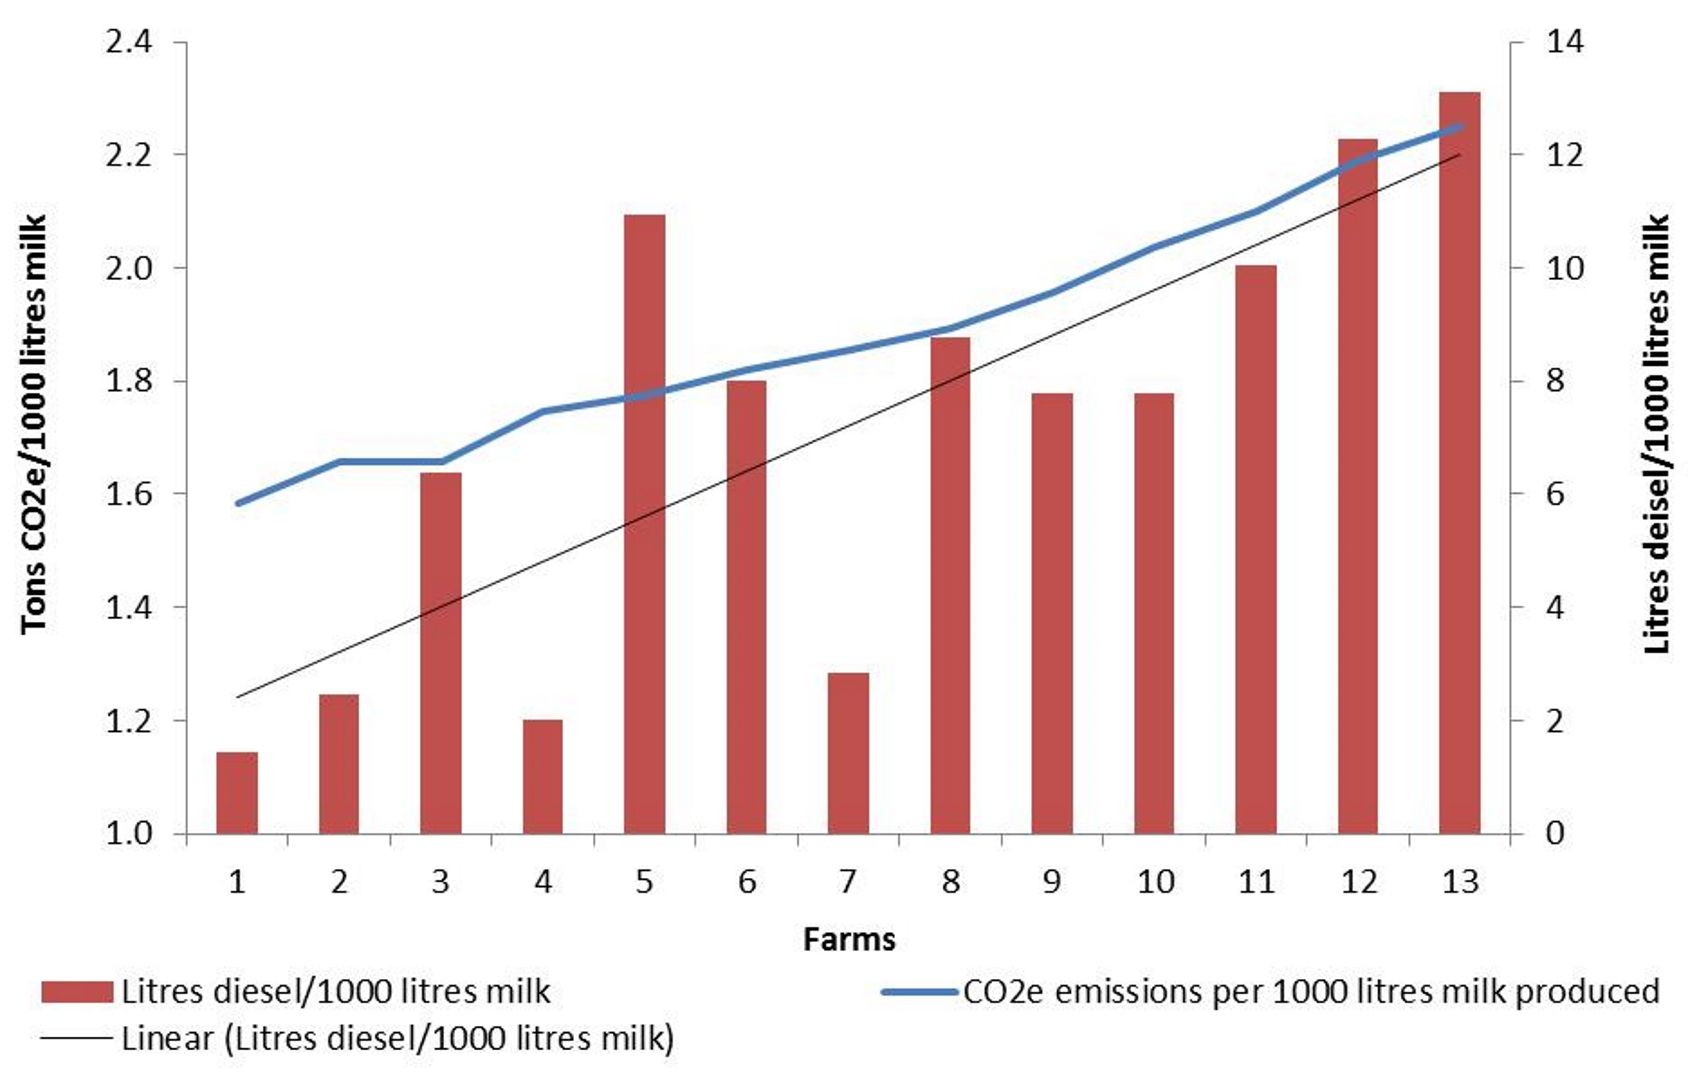
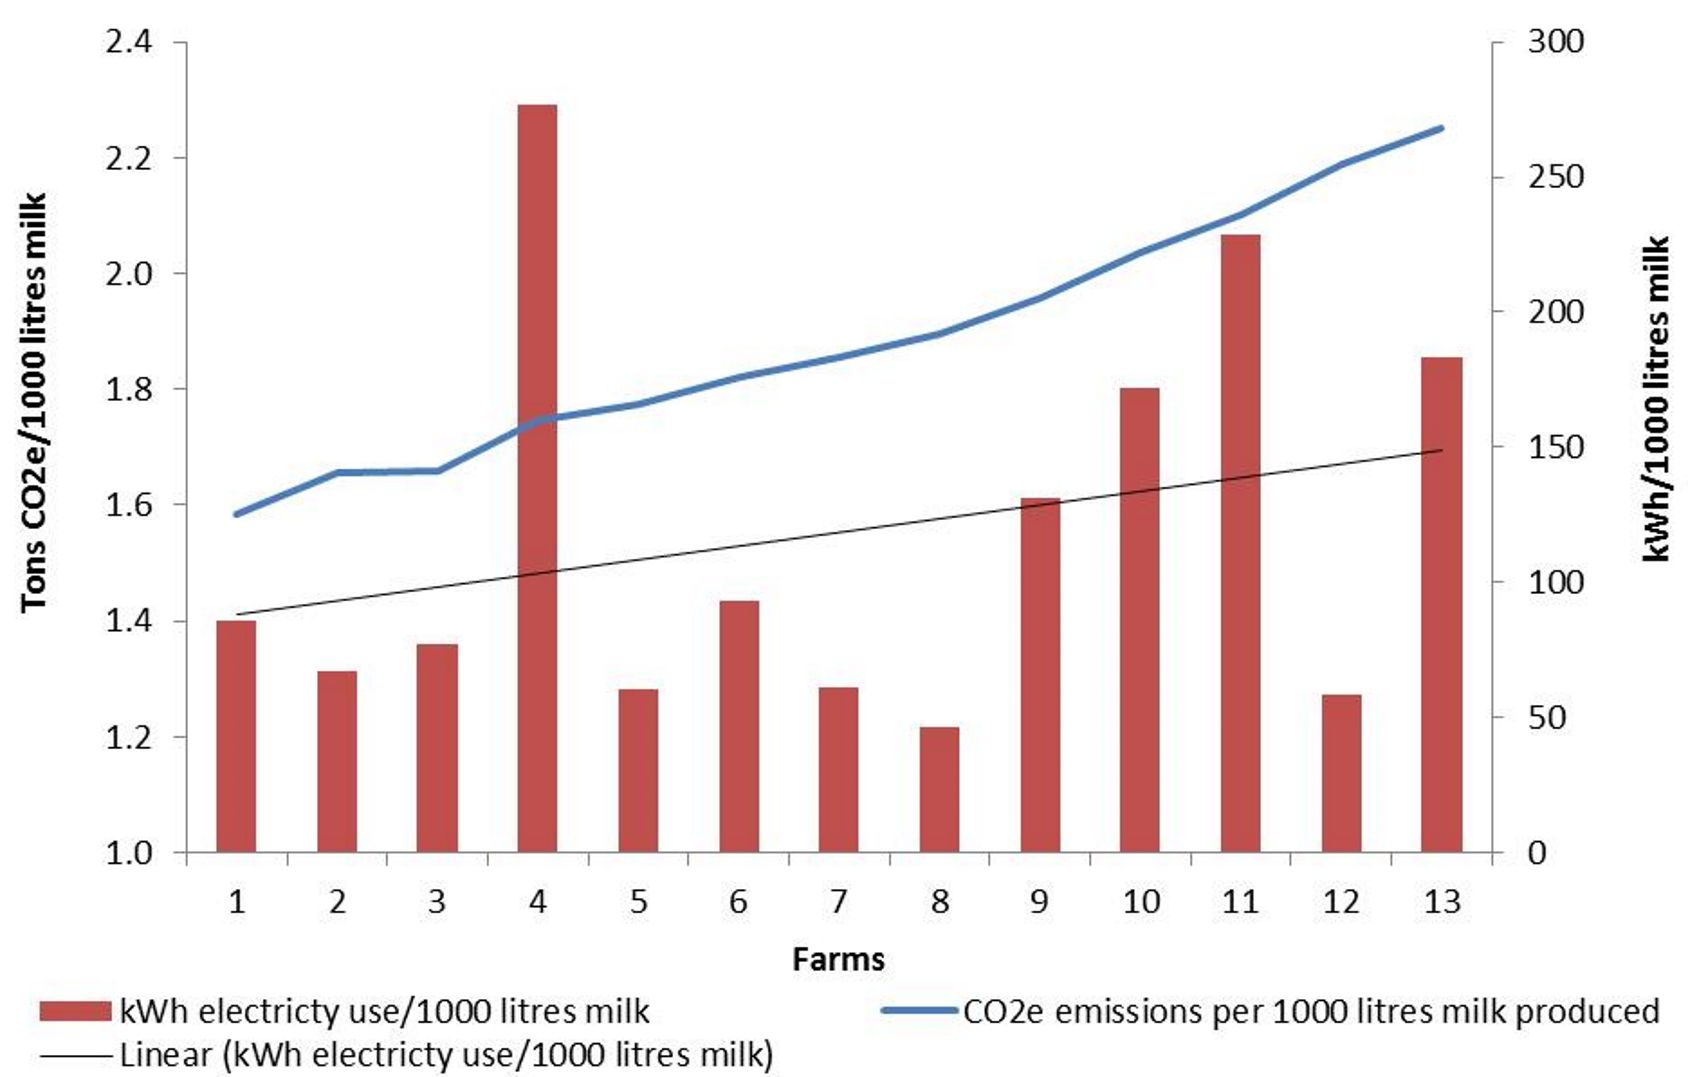
A carbon footprint can be lowered either by reducing inputs, while maintaining constant milk production, or by maintaining constant inputs while increasing milk production. There is a noticeable trend in figure 1 that the footprint increases with increasing inputs relative to milk production. Farms 4 and 7 do not seem to fit the trend, but for farm 4, figure 5 shows that they had a very large electricity usage compared to other farms. This probably has to do with the fact that farm 4 is in an area where there is lower rainfall than the other farms and therefore relies more heavily on irrigation. Farm 4 makes up for this in productivity by using the least diesel (figure 4), and in other areas of efficiency which are not covered in this case study. Farm 7’s carbon footprint is influenced by the high number of heifers (figure 7) on the farm, which obviously contribute to the footprint without contributing to milk production. Factors not addressed in this case study, such as fugitive gas emissions, concentrates and roughage fed, waste management, crop residue management and transport of goods to the farm, will also have played a role in the CO2e emissions on the farms.
Figure 1: Various inputs which influence a farm’s carbon footprint. Note: the units of the inputs have been adjusted to make them comparable to each other, the goal is to show the relationship between various inputs
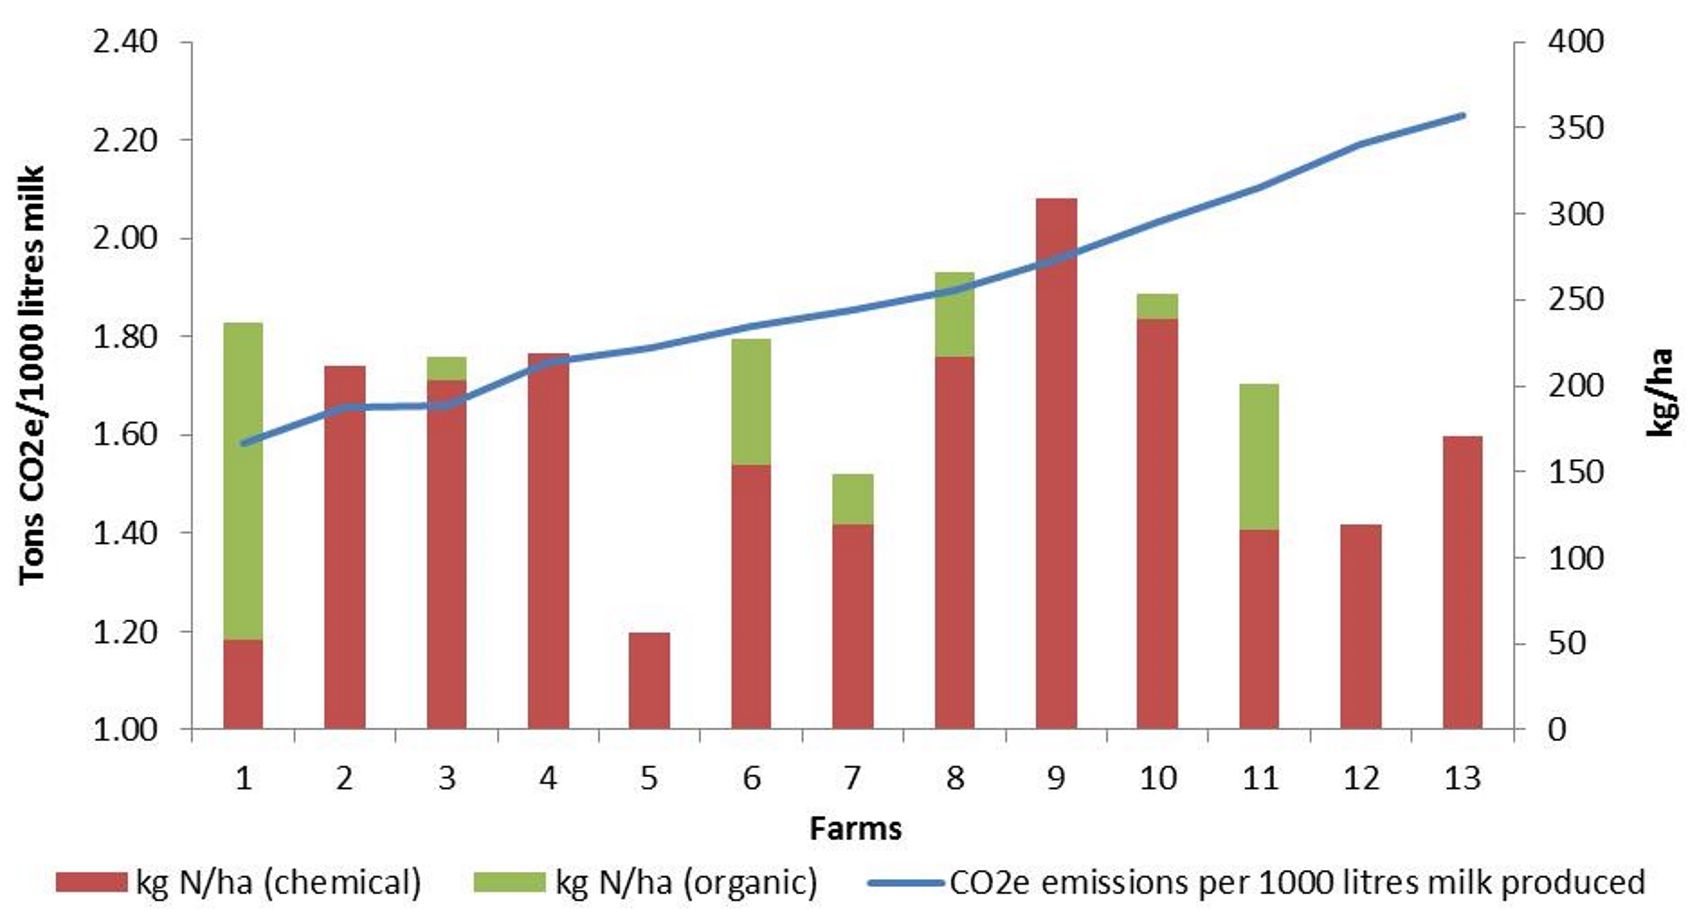
Figure 2 shows the amount of nitrogen, in both a chemical and organic form, which was applied per hectare on the farms, and the influence this had on their footprints. There is not a definite relationship between large amounts of chemical nitrogen and the tons of CO2e emitted. Nitrous oxide, a very potent greenhouse gas, is released when nitrogen fertiliser is applied to soils. There are some fertilisers which have been designed to limit the release of this gas, but the best option is to limit the amount of nitrogen fertiliser which is applied on the farm, which will help decrease costs on the farm and have a positive effect on soil health. High fertiliser use also effects scope 3 emissions as there are greenhouse gas emissions associated with the production and transport of fertiliser.
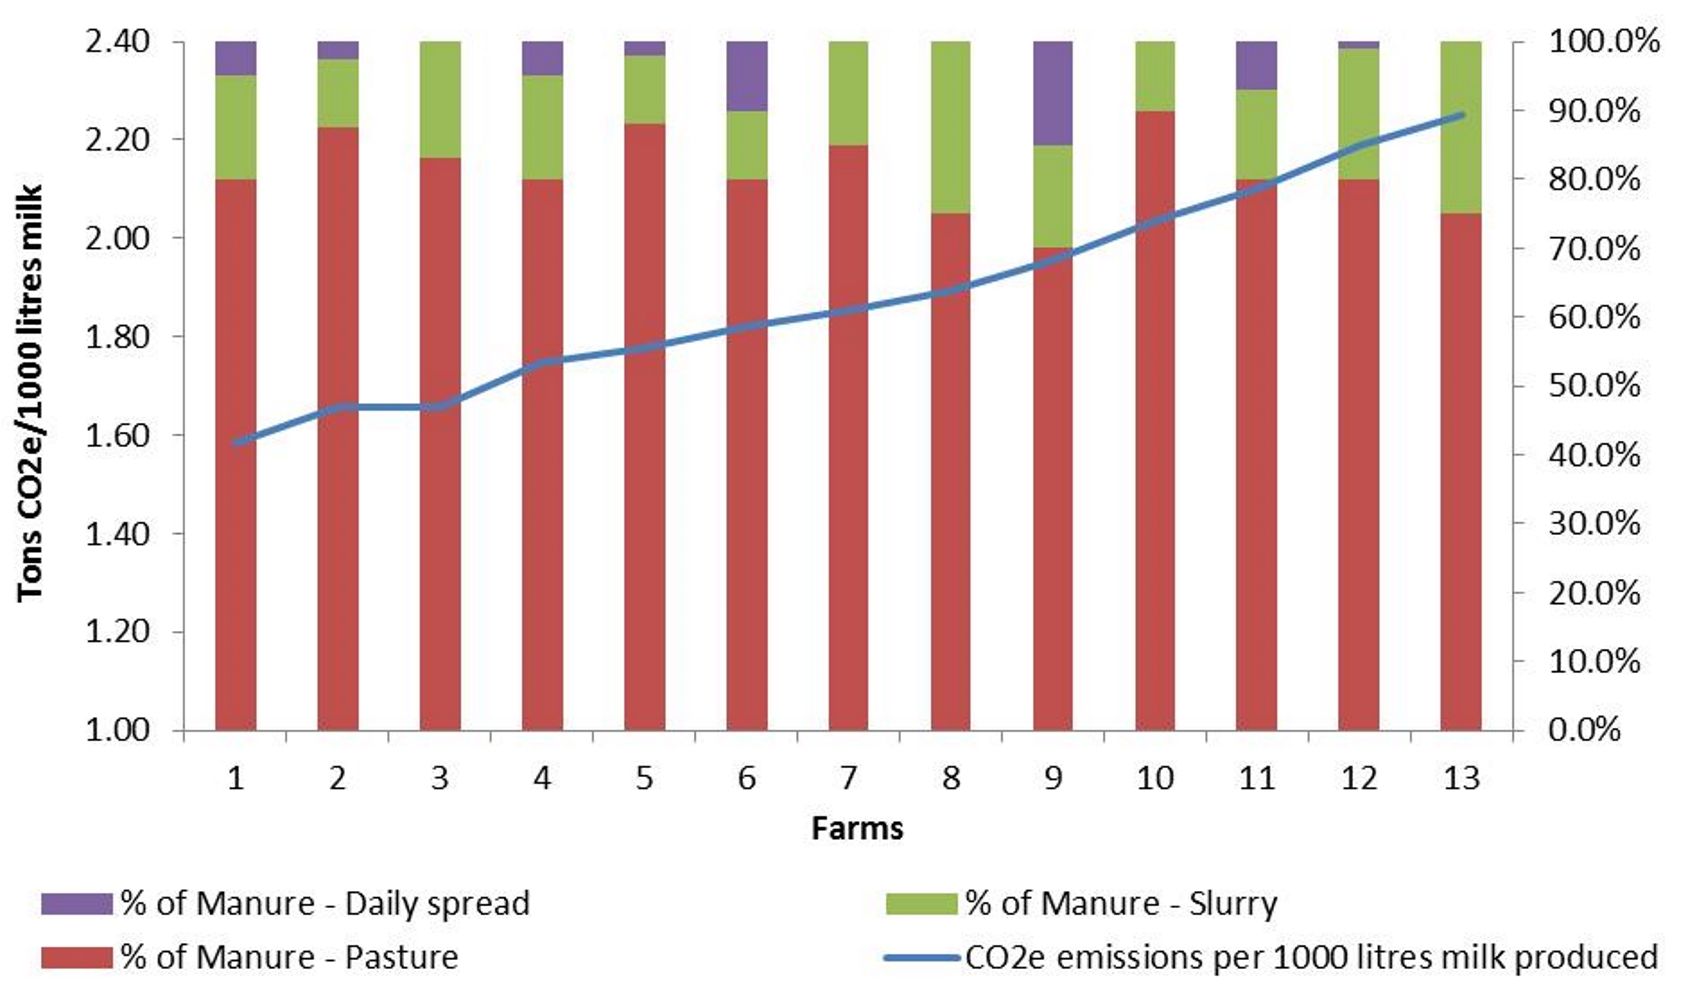
The type of manure management systems on a farm has an influence on the amount of CO2e emissions which are associated with cattle manure. The less manure stored in the form of slurry in any sort of dam or storage facility, and the more manure which is spread on the pastures, through maximising the amount of time which the cows spend on the pastures and/or by spreading the slurry which is collected from the milking parlour back onto the pastures, the lower the CO2e emissions associated with manure management will be. Figure 3 does not show this relationship very clearly, but the manure management systems of the farms in this case study are not different enough from each other to the extent that it shows on the carbon footprints. The opportunity does exist though, for farms such as farm 9, which has an equal, or larger, amount of inputs than farms 10, 11 and 12 (figure 1), but still has a lower footprint. This has been influenced by the large amount of slurry which farm 9 spreads back onto the pastures on a regular basis. The influence is similar on farm 5, which maximises the amount of time that the cows spend on the pastures and farm 6, which spreads a large amount of slurry back onto pastures.
Figure 2: Influence of nitrogen fertiliser application on a farm’s carbon footprint
Figure 3: Influence of manure management systems on a farm’s carbon footprint
Diesel is the fuel source which is used most extensively on dairy farms. The use of diesel in farm owned vehicles and by contractors causes direct greenhouse gas emissions on the farm. Emissions from contractors, which is actually a scope 3 emission, has been included so as to ensure comparability between farms, as some use their own vehicles and others use contractors for work on the farm. There is a distinct relationship between high diesel use per 1000 litres of milk production and CO2e emissions on the farms, as seen in figure 4, with the exception of a few farms (e.g. farms 4 and 7). Diesel use on farms can be limited by reducing the amount of work which is done on pastures using tractors, especially through optimising fertilisation strategies and mulching practices.
Electricity use is another contributor to greenhouse gas emissions, through gases released during the production of electricity. Figure 5 shows that, although electricity use per 1000 litres of milk produced does not have a very strong relationship with CO2e emissions, there is a slight positive relationship. This is skewed by farm 4, whose high electricity use has been explained earlier. There is an opportunity for farms to reduce their electricity use through various mechanisms such as installing solar geysers, heat exchange systems in the dairy and possibly even installing a biogas digester. This breaks down manure to methane that can be used to generate power, allowing a farm to become self-sufficient with regards to electricity use. The installation of such a biogas digester would also greatly reduce the amount of CO2e emissions from manure management.
Figure 4: Influence of litres of diesel use on a farm’s carbon footprint
Figure 5: Influence of electricity use on a farm’s carbon footprint
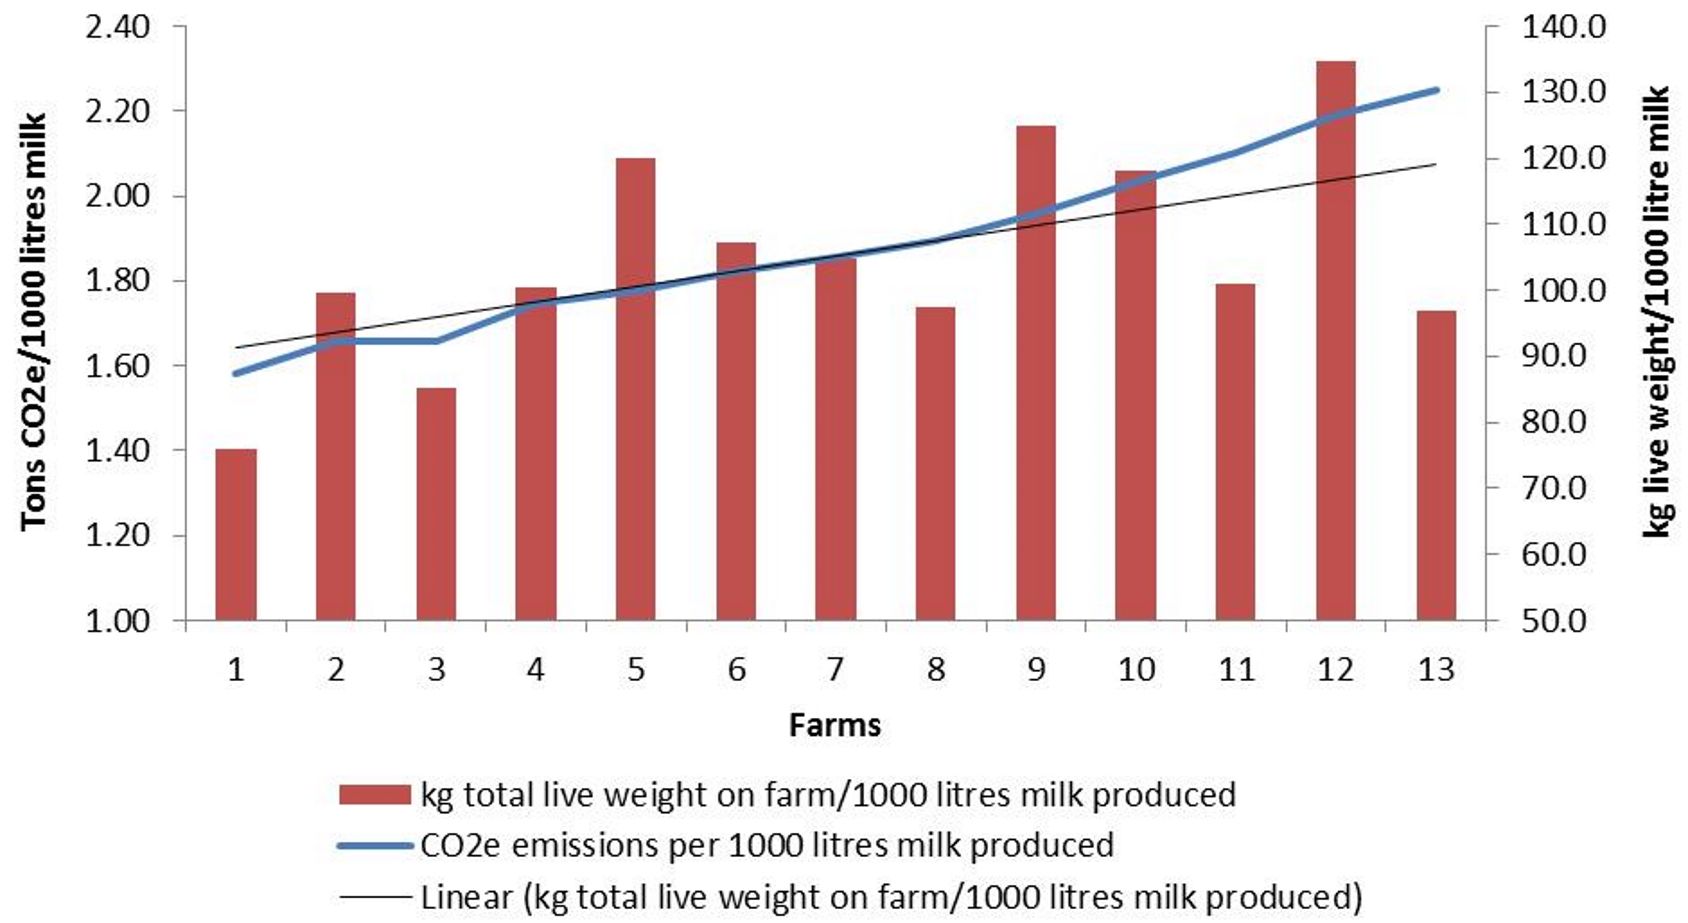
The number, and weight, of livestock greatly influences the carbon footprint of a farm due to emissions associated with enteric fermentation (methane production in the rumen of the cow). The greatest influence on enteric fermentation is the amount and size of cows on the farm relative to milk production. Figure 6 shows that there is a tendency of an increasing carbon footprint with increasing kg of total live weight on the farm per 1000 litres of milk produced. A large influencing factor in this regard is the amount of heifers that are on a farm relative to the amount of lactating cows. Figure 7 shows that the carbon footprint of a farm will tend to increase when there is a larger percentage of heifers live weight of the total live weight of cows on the farm. This is something that is largely dictated by factors that are not directly related to productivity or efficiency, but rather whether a farmer is building the milking herd and/or whether heifers are grown on the milking platform or not. This is one of the greatest factors which influence the inability to directly compare carbon footprints of different farms, even when using tons CO2e per 1000 litres of milk produced. It is informative for a farmer to know how their footprint compares to other farmers, but they would be best served by focusing on reducing their own footprint over time.
Figure 6: Influence of livestock numbers on a farm’s carbon footprint
Figure 7: Influence of the number, and age, of heifers on the farm on a farm’s carbon footprint
Carrying out a carbon footprint on a farm is a useful exercise, which farmers can use as an indicator of farm productivity. It allows a farmer to identify areas where inputs are high, especially relative to production on the farm. It is especially helpful in that it provides farmers with a measurement which can be used to monitor positive or negative changes in environmental impact and productivity over time.
- A carbon footprint assessment for pasture-based dairy farming systems in South Africa - 2024-02-07
- What progress have farms participating with Trace & Save made over the past 10 years? - 2023-09-06
- Carbon footprint reduction over time: Lessons from pasture-based dairy farms in South Africa - 2023-09-04

