Soil health and soil life are major buzz words in agriculture at the moment. One of the challenges for farmers with regards to soil life is knowing whether the practices they are implementing are positively contributing to healthy soils, which are conducive to soil organisms flourishing. To this end we have been measuring various indicators of life in the soil.
We have taken 750 soil samples on perennial irrigation and dryland pastures in the Tsitsikamma and Alexandria regions of the Eastern Cape over the past year and a half. The soil samples include composite samples which have been taken in the top 15cm of the soil profile, as well as core samples which have been taken through 60cm of the profile and have then been split into 0-15cm, 15-30cm, 30-45cm and 45-60cm samples. All of the samples have been analysed for various indicators of soil life including total carbon, active carbon, porosity and potentially mineralisable nitrogen. These analyses afford the opportunity to observe some trends which stand out amongst these soil life indicators.
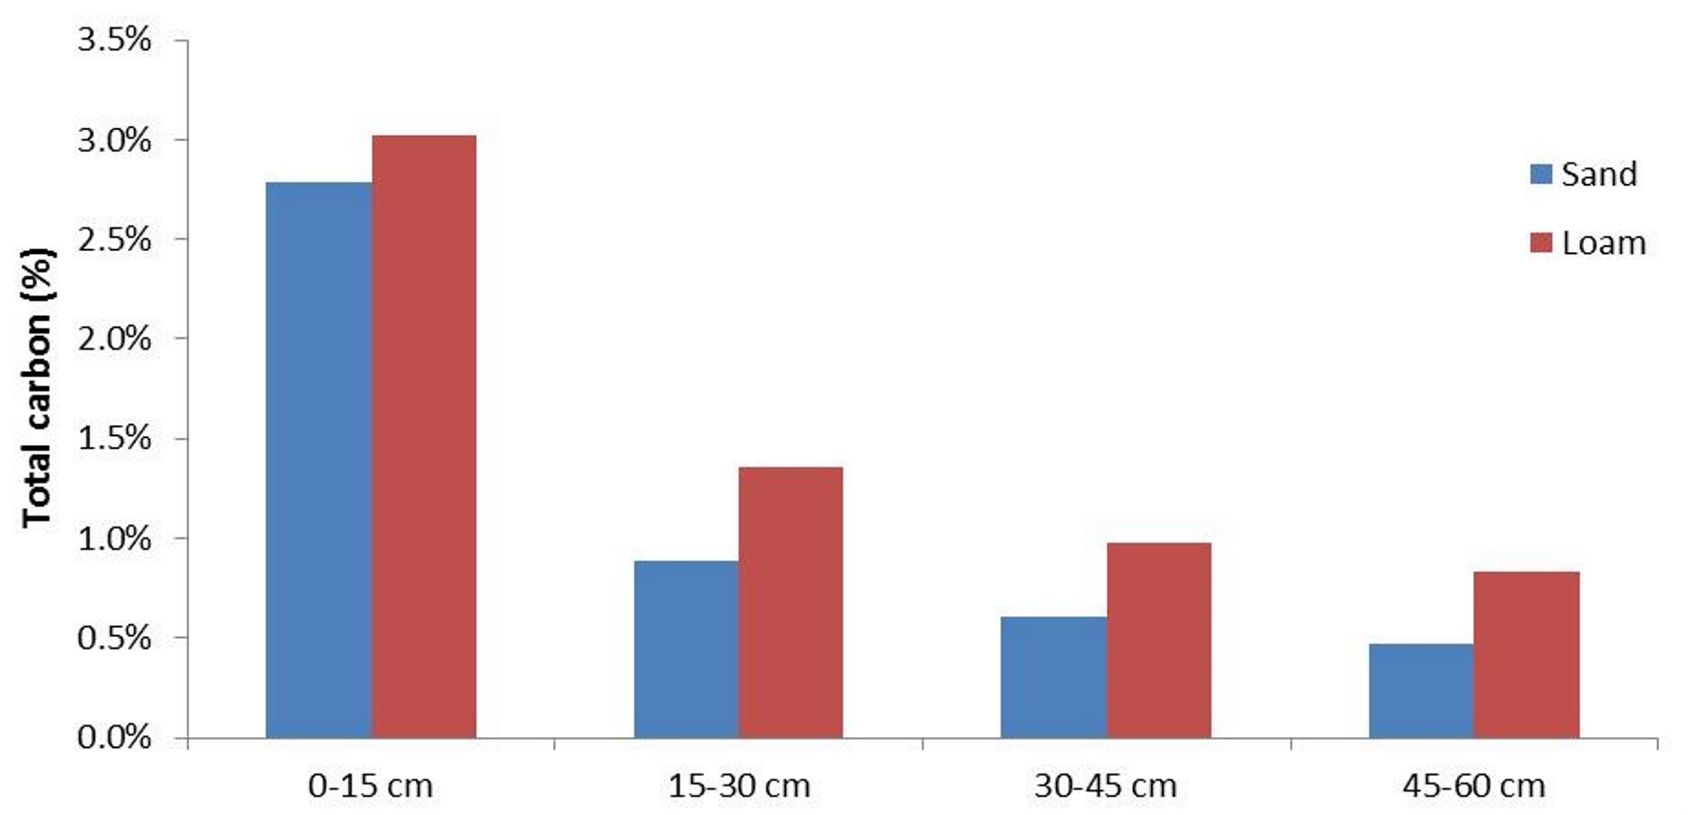
Total carbon (which is related to the organic matter content of the soil) is the most comprehensive indicator of soil life1. One of the trends is that carbon decreases through the soil profile, becoming less in deeper soil (Figure 1). Although this is to be expected, it shows that farmers have an opportunity to build carbon in the lower parts of their soil profile if they implement good soil and pasture management principles. The figure also shows that total carbon levels are higher in loamy soils than in sandy soils, which is also to be expected, as loamy soils contain more clay and clay has a greater ability to hold organic matter than sand particles1, 2.
Figure 1: Total carbon values at various depths in sandy and loamy soils
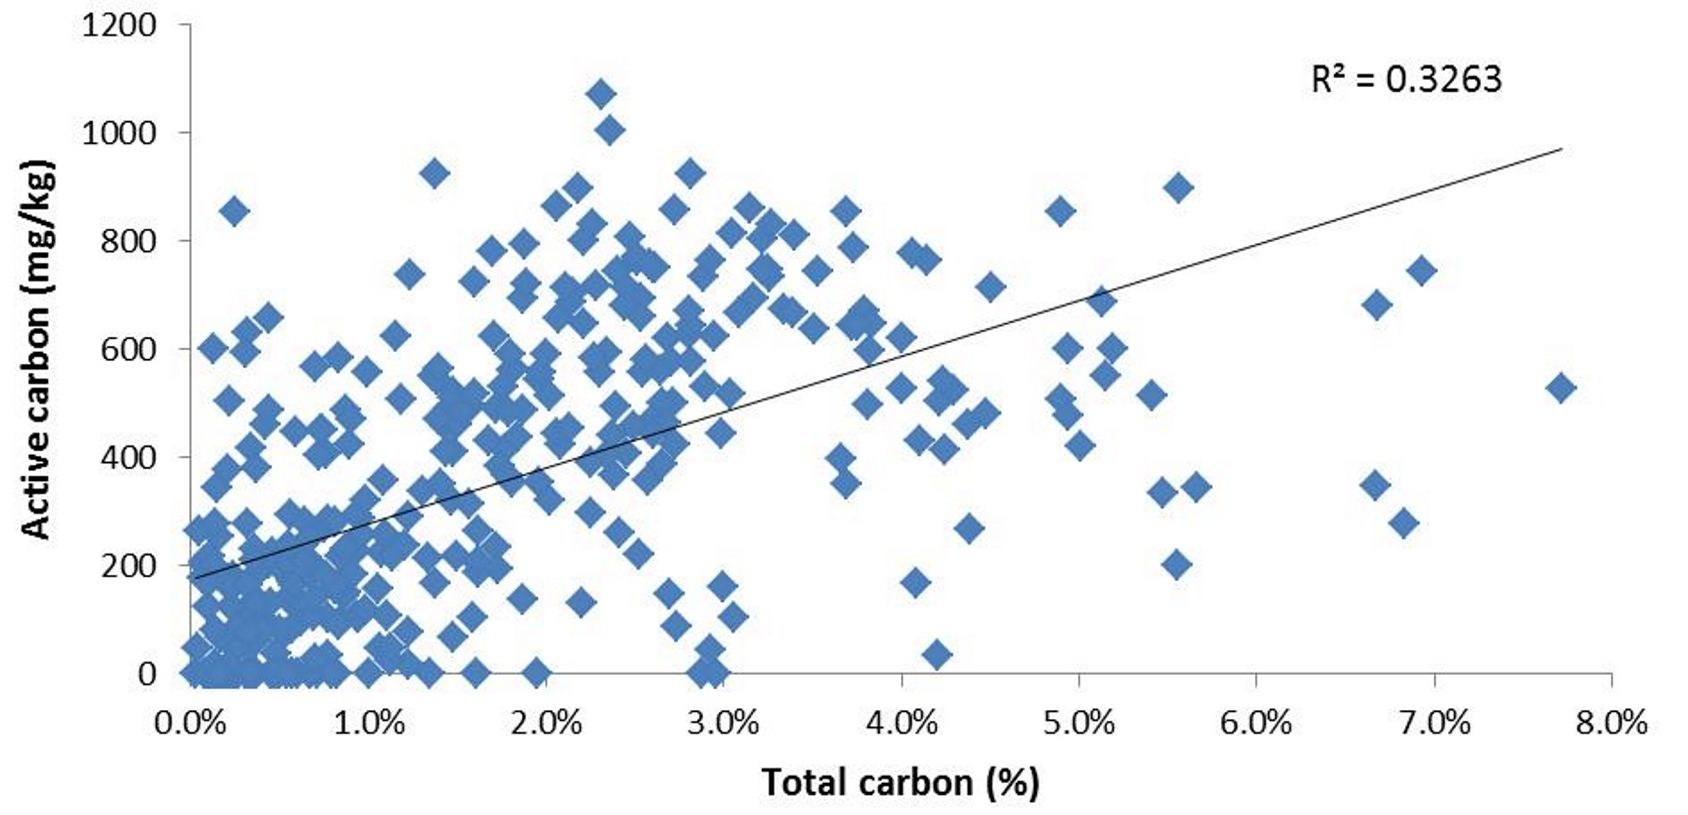
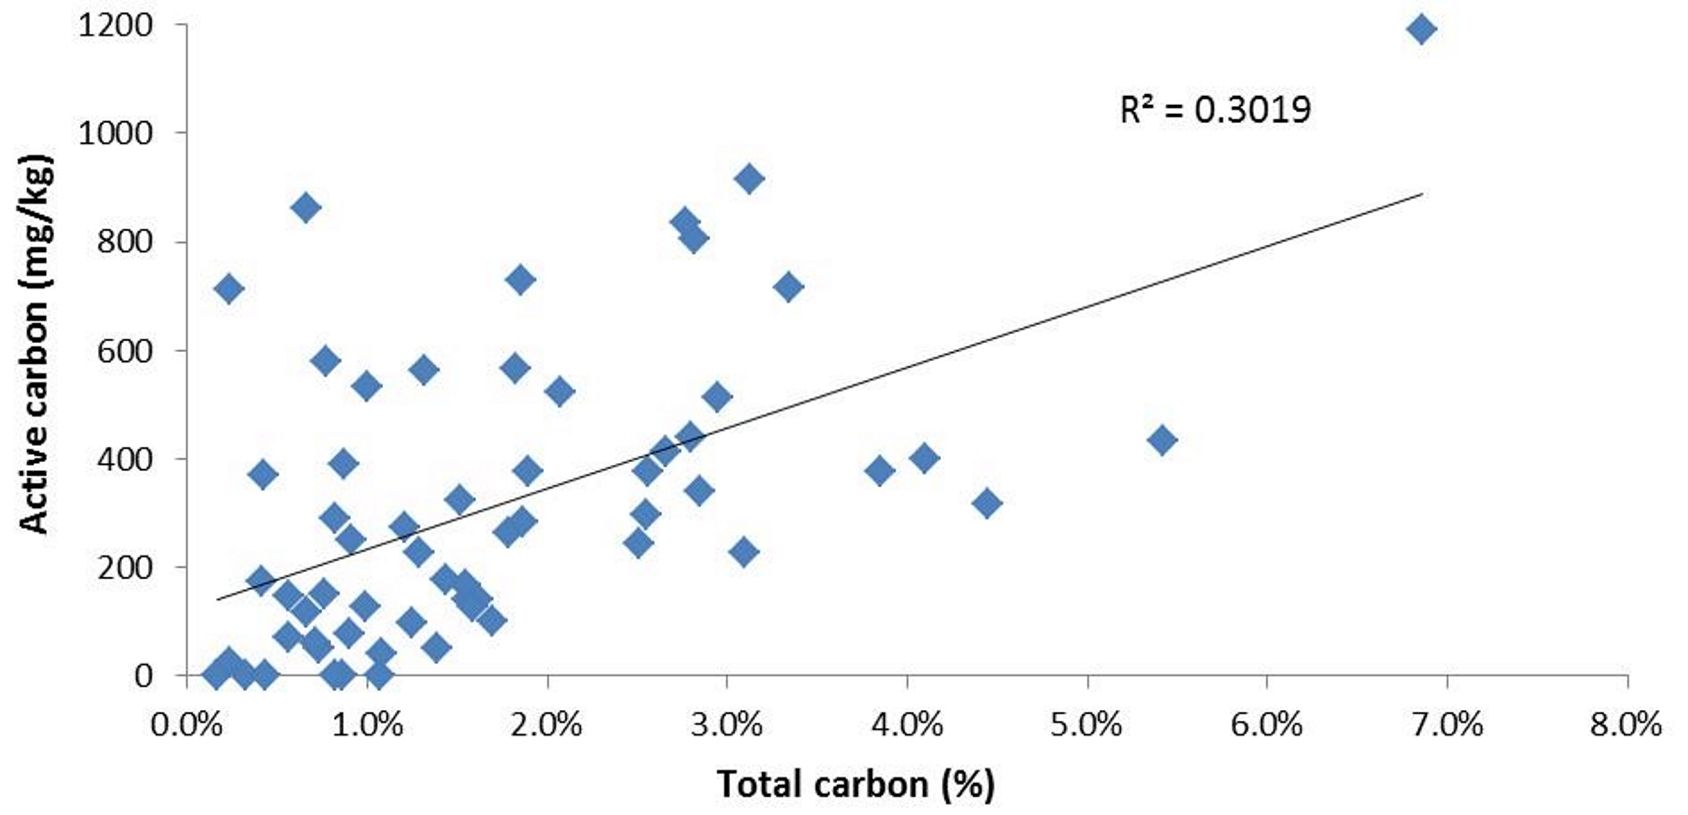
Active carbon is an indicator of soil life, as it is the part of the organic matter that is directly available as a source of energy to soil organisms1,3. Without this form of carbon in the soil, there will be a lack of freely available energy for organisms to flourish and fulfil the important functions they play in the soil. There is a relationship between total carbon and active carbon in both sandy and loamy soils (Figures 2 and 3), but the graphs show that even soils with low total carbon have potential for high active carbon, and therefore active soil life.
Figure 2: Relationship between total carbon and active carbon in sandy soils
Figure 3: Relationship between total carbon and active carbon in loamy soils
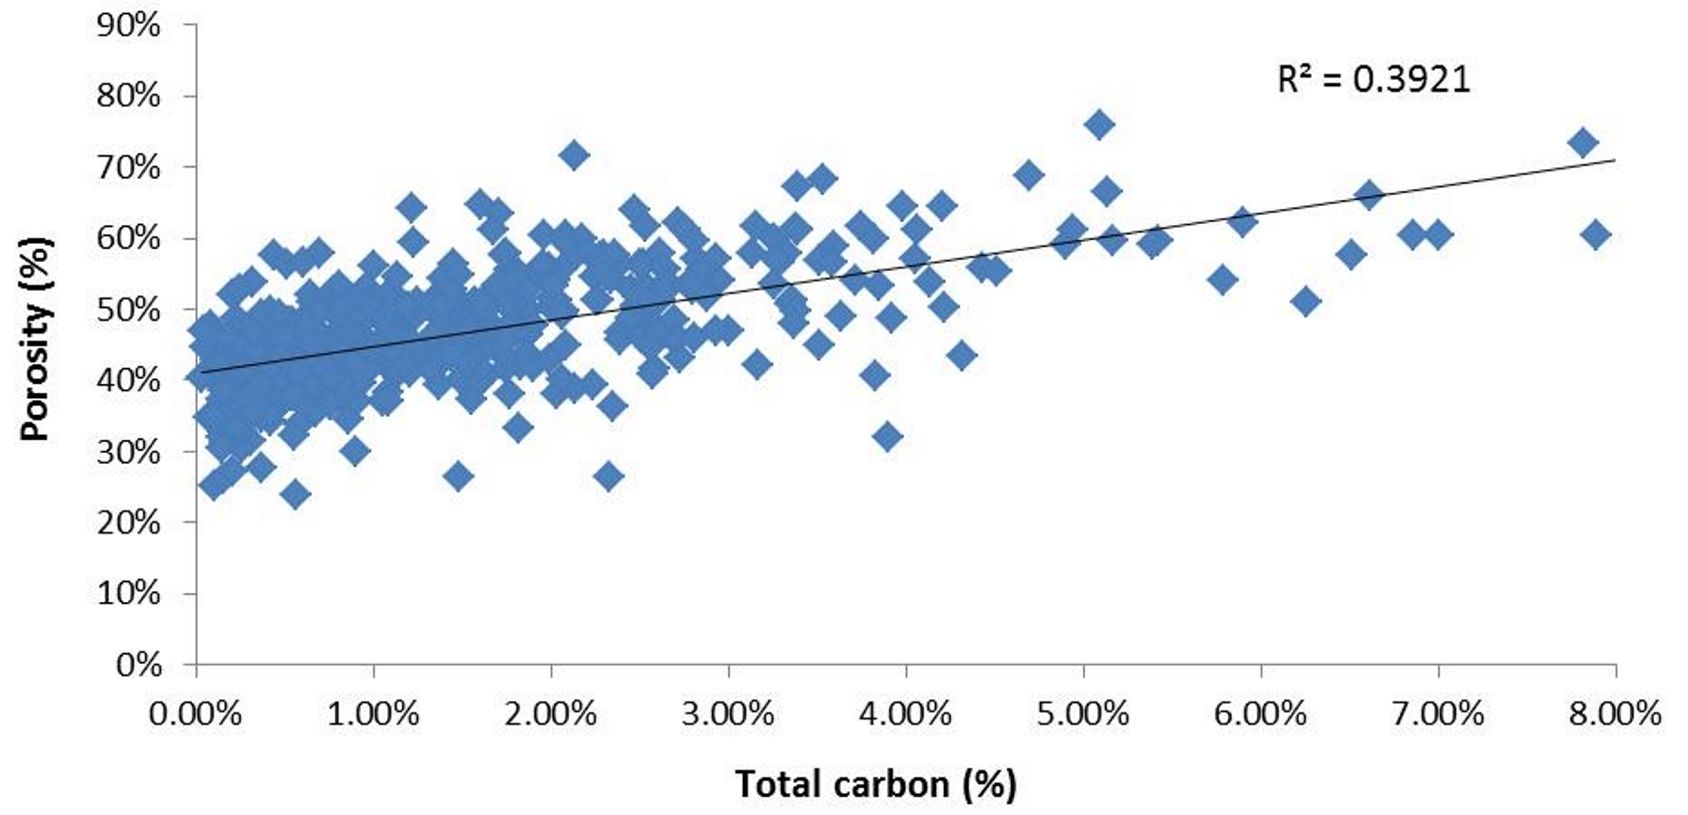
Figure 4: Relationship between total carbon and porosity in sandy and loamy soils
Figure 4 shows the expected relationship between total carbon and porosity1. This is further evidence that carbon helps to build soil structure. Higher levels of carbon result in greater amounts of pore spaces for water and air, which are necessary for soil life to thrive. There is enough variation though to show that total carbon is not the only influencer of porosity, as factors such as soil type and compaction also play a role in the porosity of the soil.
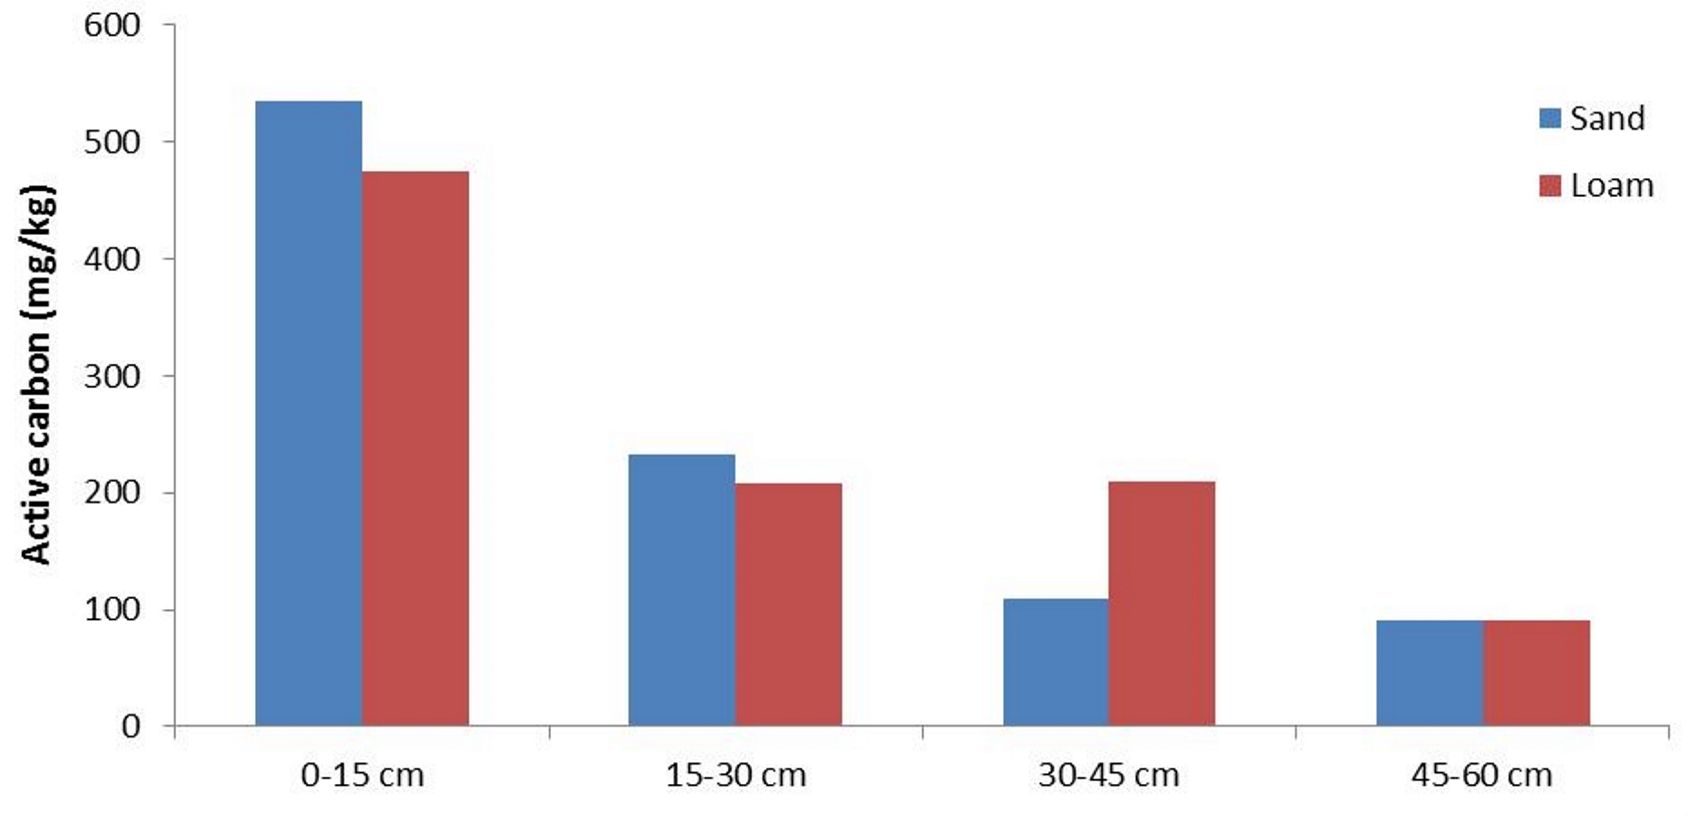
Active carbon values also decrease, much like total carbon, through the depth of a soil profile (Figure 5). This is to be expected, as soil life is most active in the top 15cm of a soil profile, although what is quite unexpected is that the active carbon values are slightly higher in the sandy soil for the top 30cm than the loamy soil1.
Figure 5: Active carbon values at various depths in sandy and loamy soil
Figure 6: Potentially mineralisable nitrogen rate at various depths in sandy and loamy soils
Potentially mineralisable nitrogen (PMN) rate is a measure of the potential for conversion of organic nitrogen to the inorganic, plant available, form1. This is measured in a lab, under ideal conditions, as the daily increase in nitrates and ammonium (inorganic, plant-available forms of nitrogen) in the soil. This is an indicator of soil life, as the mineralisation of nitrogen is carried out by soil organisms, therefore if mineralisation is taking place, there must be life1. Figure 6 shows a decrease in the PMN rate as the depth increases, except for in loamy soil in 30-45cm.
Table 1: Variation in total and active carbon based on grouping potentially mineralisable nitrogen rates
There were no relationships found between total carbon and PMN rate or active carbon and PMN rate. A very interesting observation was made though. It has been noted, in the process of carrying out analyses of soil samples and interpreting the results, that the PMN rate is sometimes negative even though all the other indicators of soil life are positive. An explanation of this is that sometimes there is activity of soil life, without the conversion of organic nitrogen, i.e. mineralisation does not take place instead the reverse processes of immobilization and denitrification occur. Immobilization occurs in soils that have an imbalance in soil life and a high C:N ratio, but still have active soil life. Due to the imbalance of organisms, and lack of nitrogen compared to the amount of carbon, there is a high demand of available nitrogen by the soil organisms. This results in the use of available nitrogen in the soil by the soil organisms at a greater rate than what they convert it4. Denitrification is the process of convertion of available nitrogen to gaseous forms. This can result in a negetive mineralisation rate. It occurs under waterlogged soils, where oxygen is limiting, causing soil organisms to utilise the oxygen in NO3– resulting in the loss of nitrogen from the soil in the form of N2O, which is a gas4. Table 1 shows that in soils where the rate was less than -1 mg/kg/day, which implies there is life, because something is using the available nitrogen, but there is no evidence of conversion of organic nitrogen to the inorganic form, that there are higher averages of total and active carbon than in soils where there is a PMN rate of between -1 and 1 mg/kg/day. In these soils the case may be that both mineralisation and immobilisation are taking place, but immobilisation is occuring at a quicker rate. Soils where the PMN rate is greater than 1 mg/kg/day have the highest averages for total and active carbon. This shows that highly negative PMN rates are not neccesarily indicative of no soil life, but rather marginally negative and marginally positive rates are an indicator of minimal soil life.
The results from these 750 soil sample analyses show the trends in pasture soils for indicators of soil life. These results show averages for sandy and loamy soils which farmers can aim for in pastures. They also show that the indicators of soil life are interrelated and interact with each other. Every farmer should be aiming for increased life in their soil, as this will significantly contribute to soil health, especially with regards to the cycling and natural conversion of nutrients. Soil life also helps to build good structure. These all contribute to better crop/pasture production, which is beneficial.
References:
- Gugino BK, Idowu OJ, Schindelbeck RR, van Es HM, Wolfe DW, Moebius-Clune BN, Thies JE & Abawi GS. 2009. Cornell Soil Health Assessment Training Manual, Edition 2.0, Cornell University, Geneva, NY.
- Yara. Technical Bulletin No. 5. Soil Organic Matter. http://www.yara.com/doc/36655_Soil%20organic%20matter.pdf – Accessed 11 September 2014.
- Hoyle F, Murphy D & Sheppard J. Labile Carbon. Fact Sheets. http://soilquality.org.au/factsheets/labile-carbon – Accessed 11 September 2014.
- Johnson C, Albrecht G, Ketterings Q, Beckman J & Stockin K. 2005. Nitrogen Basics – The Nitrogen Cycle. Agronomy Fact Sheet Series. Cornell University Cooperative Extension, College of Agriculture and Life Sciences, Department of Crop and Soil Sciences.
- A carbon footprint assessment for pasture-based dairy farming systems in South Africa - 2024-02-07
- What progress have farms participating with Trace & Save made over the past 10 years? - 2023-09-06
- Carbon footprint reduction over time: Lessons from pasture-based dairy farms in South Africa - 2023-09-04


