There are numerous blogs on this website, and all over the web, about the theories, ideas and practices of sustainable agriculture and reducing environmental impact. Trace & Save has been working on dairy farms in the Eastern Cape for almost five years now. We have been encouraging dairy farmers to adopt the sustainable practices which are discussed in these blogs, and measuring sustainability indicators on their farms. We measure these indicators so that farmers can observe whether the practices they are implementing are actually making any difference, as well as to show you, the consumer, the positive effect of their sustainable practices. In two previous blogs, I have given examples of a carbon footprint success story and a soil carbon success story. In these blogs I go into the details of the importance of a farm reducing their carbon footprint, and building their soil carbon. In this blog I would like to expand on these previous blogs by showing carbon footprint and soil carbon data from a much larger group of farms. Some of the farms whose data is shown have put in a large amount of effort to improve their practices to become more sustainable, and deserve their due credit for the hard work they have put in. Other farms have not shown improvements, and serve as examples of where there is still much more work that needs to be done. The purpose of this blog is also to show that the success stories are not limited to just one or two farms.
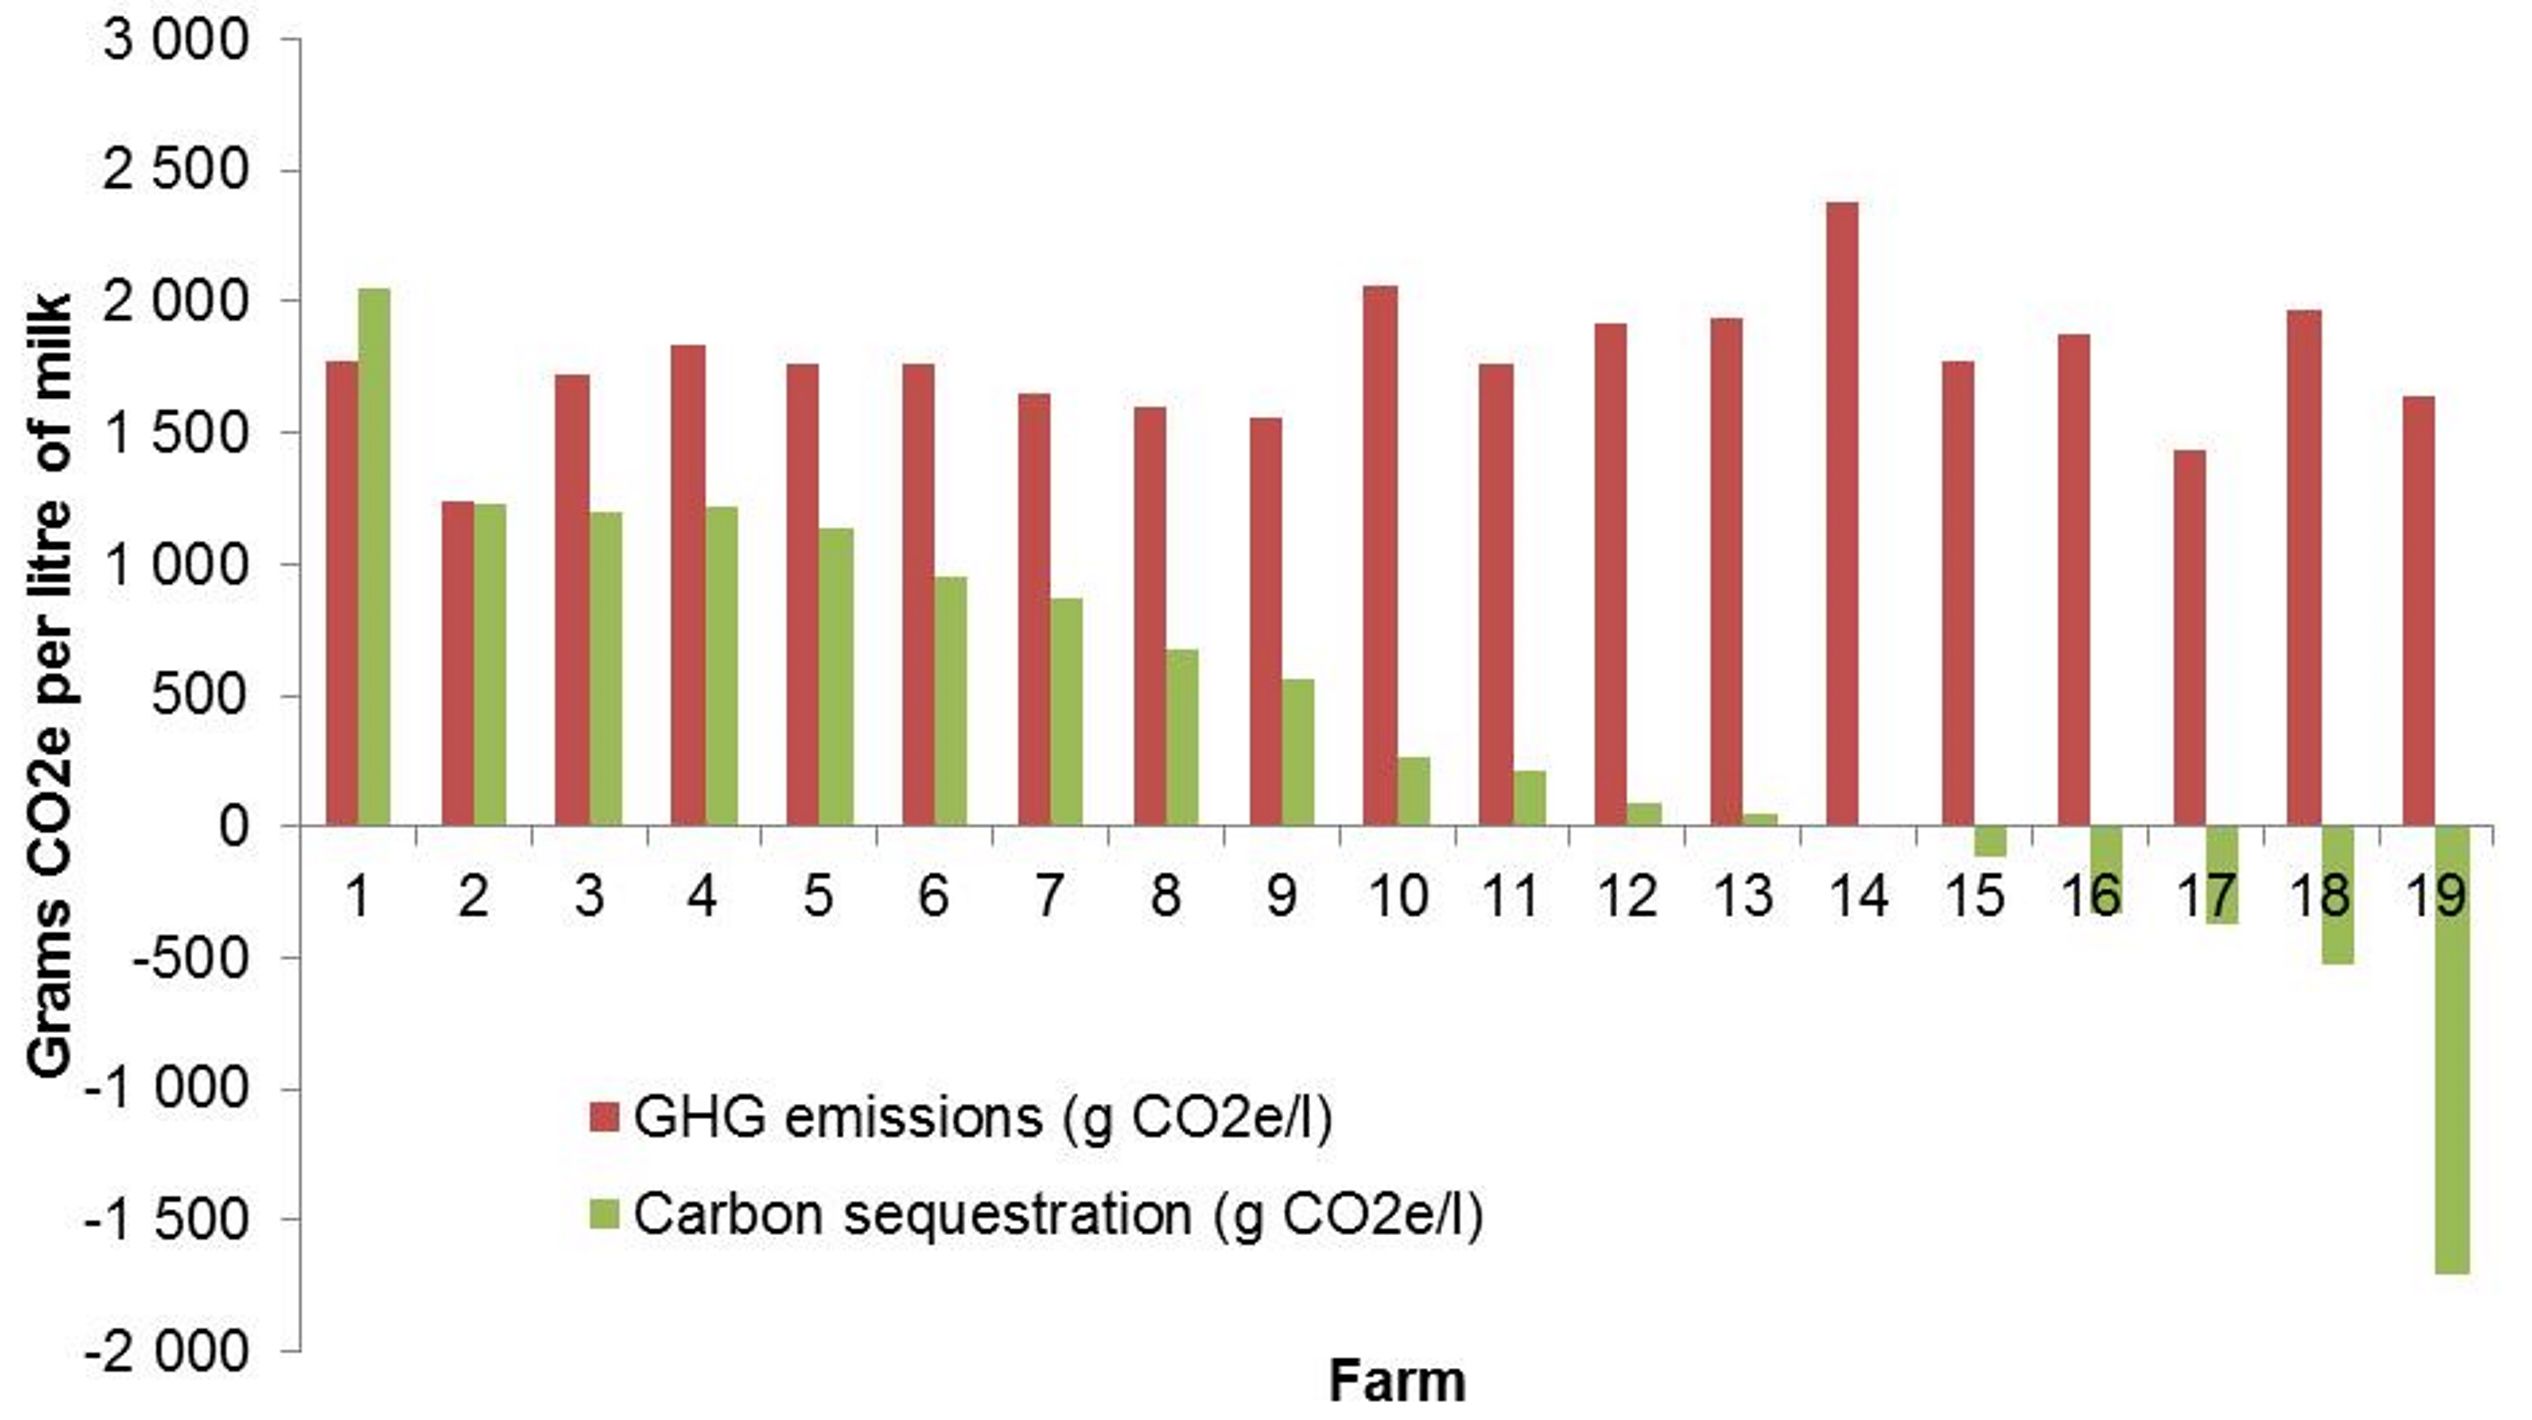
I have looked at data from 19 of the farms that Trace & Save has been working on, where both soil carbon and farm production data has been collected at least twice. This allows us to see whether there has been an increase in the soil carbon levels, and get a good idea of what the carbon footprint has been over more than two years. The first graph below shows the relationship between the amount of carbon which has been transferred into the soil (carbon sequestration), and the amount of greenhouse gas emissions which have been released on these farms. I have calculated each in grams of carbon dioxide equivalents per litre of milk that has been produced on the farms (g CO2e/l). If you have any questions about these calculations, feel free to ask in the comments section below. This allows us to compare the positive impact that results from carbon sequestration, and the negative impact that results from greenhouse gas emissions. As you will see on the first 13 farms, there has been a build-up of carbon in the soil. In other words, the soil is becoming a sink for carbon dioxide, taking it out of the atmosphere and storing it in the soil. On farm 14 there has been no change in soil carbon levels. On farms 15 to 19 there has been a decrease in soil carbon levels. This is not ideal, and it is on these farms where we especially emphasise the need for sustainable soil management practices which will reverse this trend in time. On most of the farms the greenhouse gas emissions are in the range of 1500-2000 g CO2e/l. On farms such at 10, 14 and 18, we challenge these farms to reduce their greenhouse gas emissions, assisting them in identifying the opportunities on their farms to do this, and provide advice on what practice they can implement to lower their emissions. Farm number 2 has managed to emit only 1250 g CO2e/l, which is most impressive.
I have also previously discussed the idea that Cows might actually be part of the solution to the excessive carbon dioxide levels in the atmosphere, which are one of the major causes of global climate change. It is all good and well that we write about these ideas, but it is another thing when they are actually being put into practices. As discussed, the data that I have shown in the graph above shows that on many of the farms, there is a lot of carbon being pulled back into the soil. On farm number one though, this has even reached the point where the amount of carbon that has been transferred back into the soil exceeds the amount of greenhouse gas emissions that have been released on the farm. This means that this farm is actually carbon positive. This is an example of a farm which is actually having an overall positive impact, not the kind of story you often hear about farming. There are obviously those farms, such as 15-19, which are still having a large negative impact, but rather than shaming these farms, we aim to support them to improve their practices, using what we have learned on the farms that are producing milk more sustainably.
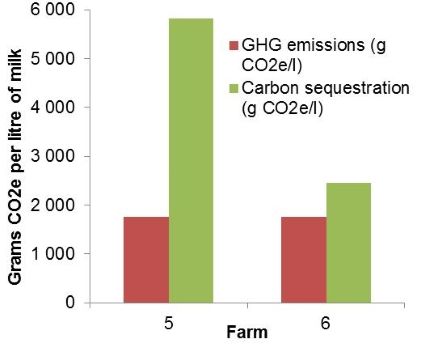
The soil samples used in the graph above were only taken in the top 15cm of the soil on the main areas of these farms. We also take soil samples in the top 60cm, but have not collected these samples on as many farms. Taking samples to a depth of 60cm is important as this allows us to get a much better idea of what is happening, especially with regards to the movement, build-up, and/or loss of nutrients. Plant roots go a lot deeper than 15cm, also making taking samples to a deeper depth important. By way of example, and to show how much potential there is for farms to have a positive impact, the graph to the right provides the data for two of the farms where the full 60cm samples have been taken. The examples used are from farms 5 and 6 in the above graph. On these farms, they have increased the carbon levels throughout the 60cm soil depth, showing a much larger quantity of carbon being sequestered. On farm 5, more than three times the amount of CO2e being emitted for every litre of milk that is produced, is being returned to the soil. I think many people have been sceptical of the idea that dairy farms could possibly be carbon neutral, but this data shows that this is actually possible. This is a massive positive impact! The theory is being put into action.
We are highly motivated by the farms which have been able to make such positive changes regarding sustainability over the past five years. We are excited to see the positive environmental impact, which we believe farms can have when sustainable practices are adopted, being shown in the data that we collect. We will continue to encourage farmers that are doing well, and challenging and supporting farmers that have not quite gotten there yet to improve their practices.
- A carbon footprint assessment for pasture-based dairy farming systems in South Africa - 2024-02-07
- What progress have farms participating with Trace & Save made over the past 10 years? - 2023-09-06
- Carbon footprint reduction over time: Lessons from pasture-based dairy farms in South Africa - 2023-09-04


