The Woodlands Dairy Sustainability Project (Read blog: Woodlands Dairy partners with Trace & Save) has been ongoing for just over four years now, and we are starting to see some success stories on the farms that we have been working with. I have recently been collating some of the data from one of the farms in the Tsitsikamma who has put concerted effort into making their farming system more sustainable. The only way that we can tell whether the farm is becoming more sustainable is by seeing whether the sustainability indicators are improving. An example of such an indicator is the carbon footprint (Read blog: Carbon footprint of a farm, why does it matter?) we do on every farm each year.
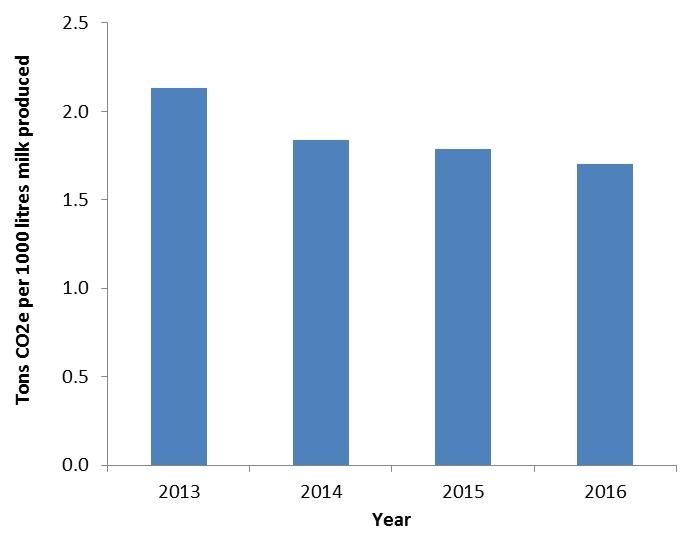
This particular farmer has been working hard to improve the health of his soils, to increase the efficiency of his farm, and increase the milk production on his farm. As can be seen in the graph below, the greenhouse gas emissions (measured in carbon dioxide equivalents) for every 1000 litres of milk produced on the farm has reduced from 2.13 to 1.70 over the past four years. This difference of 0.43 tons of CO2e per 1000 litres of milk is the equivalent saving of the greenhouse gas emissions from 621 passenger vehicles driven for a year for the amount of milk produced on the farm in 2016. That is a significant reduction in the amount of greenhouse gas emissions associated with milk production.
This kind of decrease means that the environmental impact of each litre of milk being produced is reduced. The Woodlands Dairy Sustainability Project, which applies the Trace & Save system, aims to support farmers to reduce the environmental impact of their farming practices.
- A carbon footprint assessment for pasture-based dairy farming systems in South Africa - 2024-02-07
- What progress have farms participating with Trace & Save made over the past 10 years? - 2023-09-06
- Carbon footprint reduction over time: Lessons from pasture-based dairy farms in South Africa - 2023-09-04
