Sustainable agriculture often suffers from a case of lots of theory but not much relevant data to back up how it has worked practically. Trace & Save would like to change that by sharing case studies of how farms have become more sustainable over time through the implementation of good management practices. The farms included in these case studies are pasture-based dairy farms in the Eastern Cape, South Africa.
Introduction
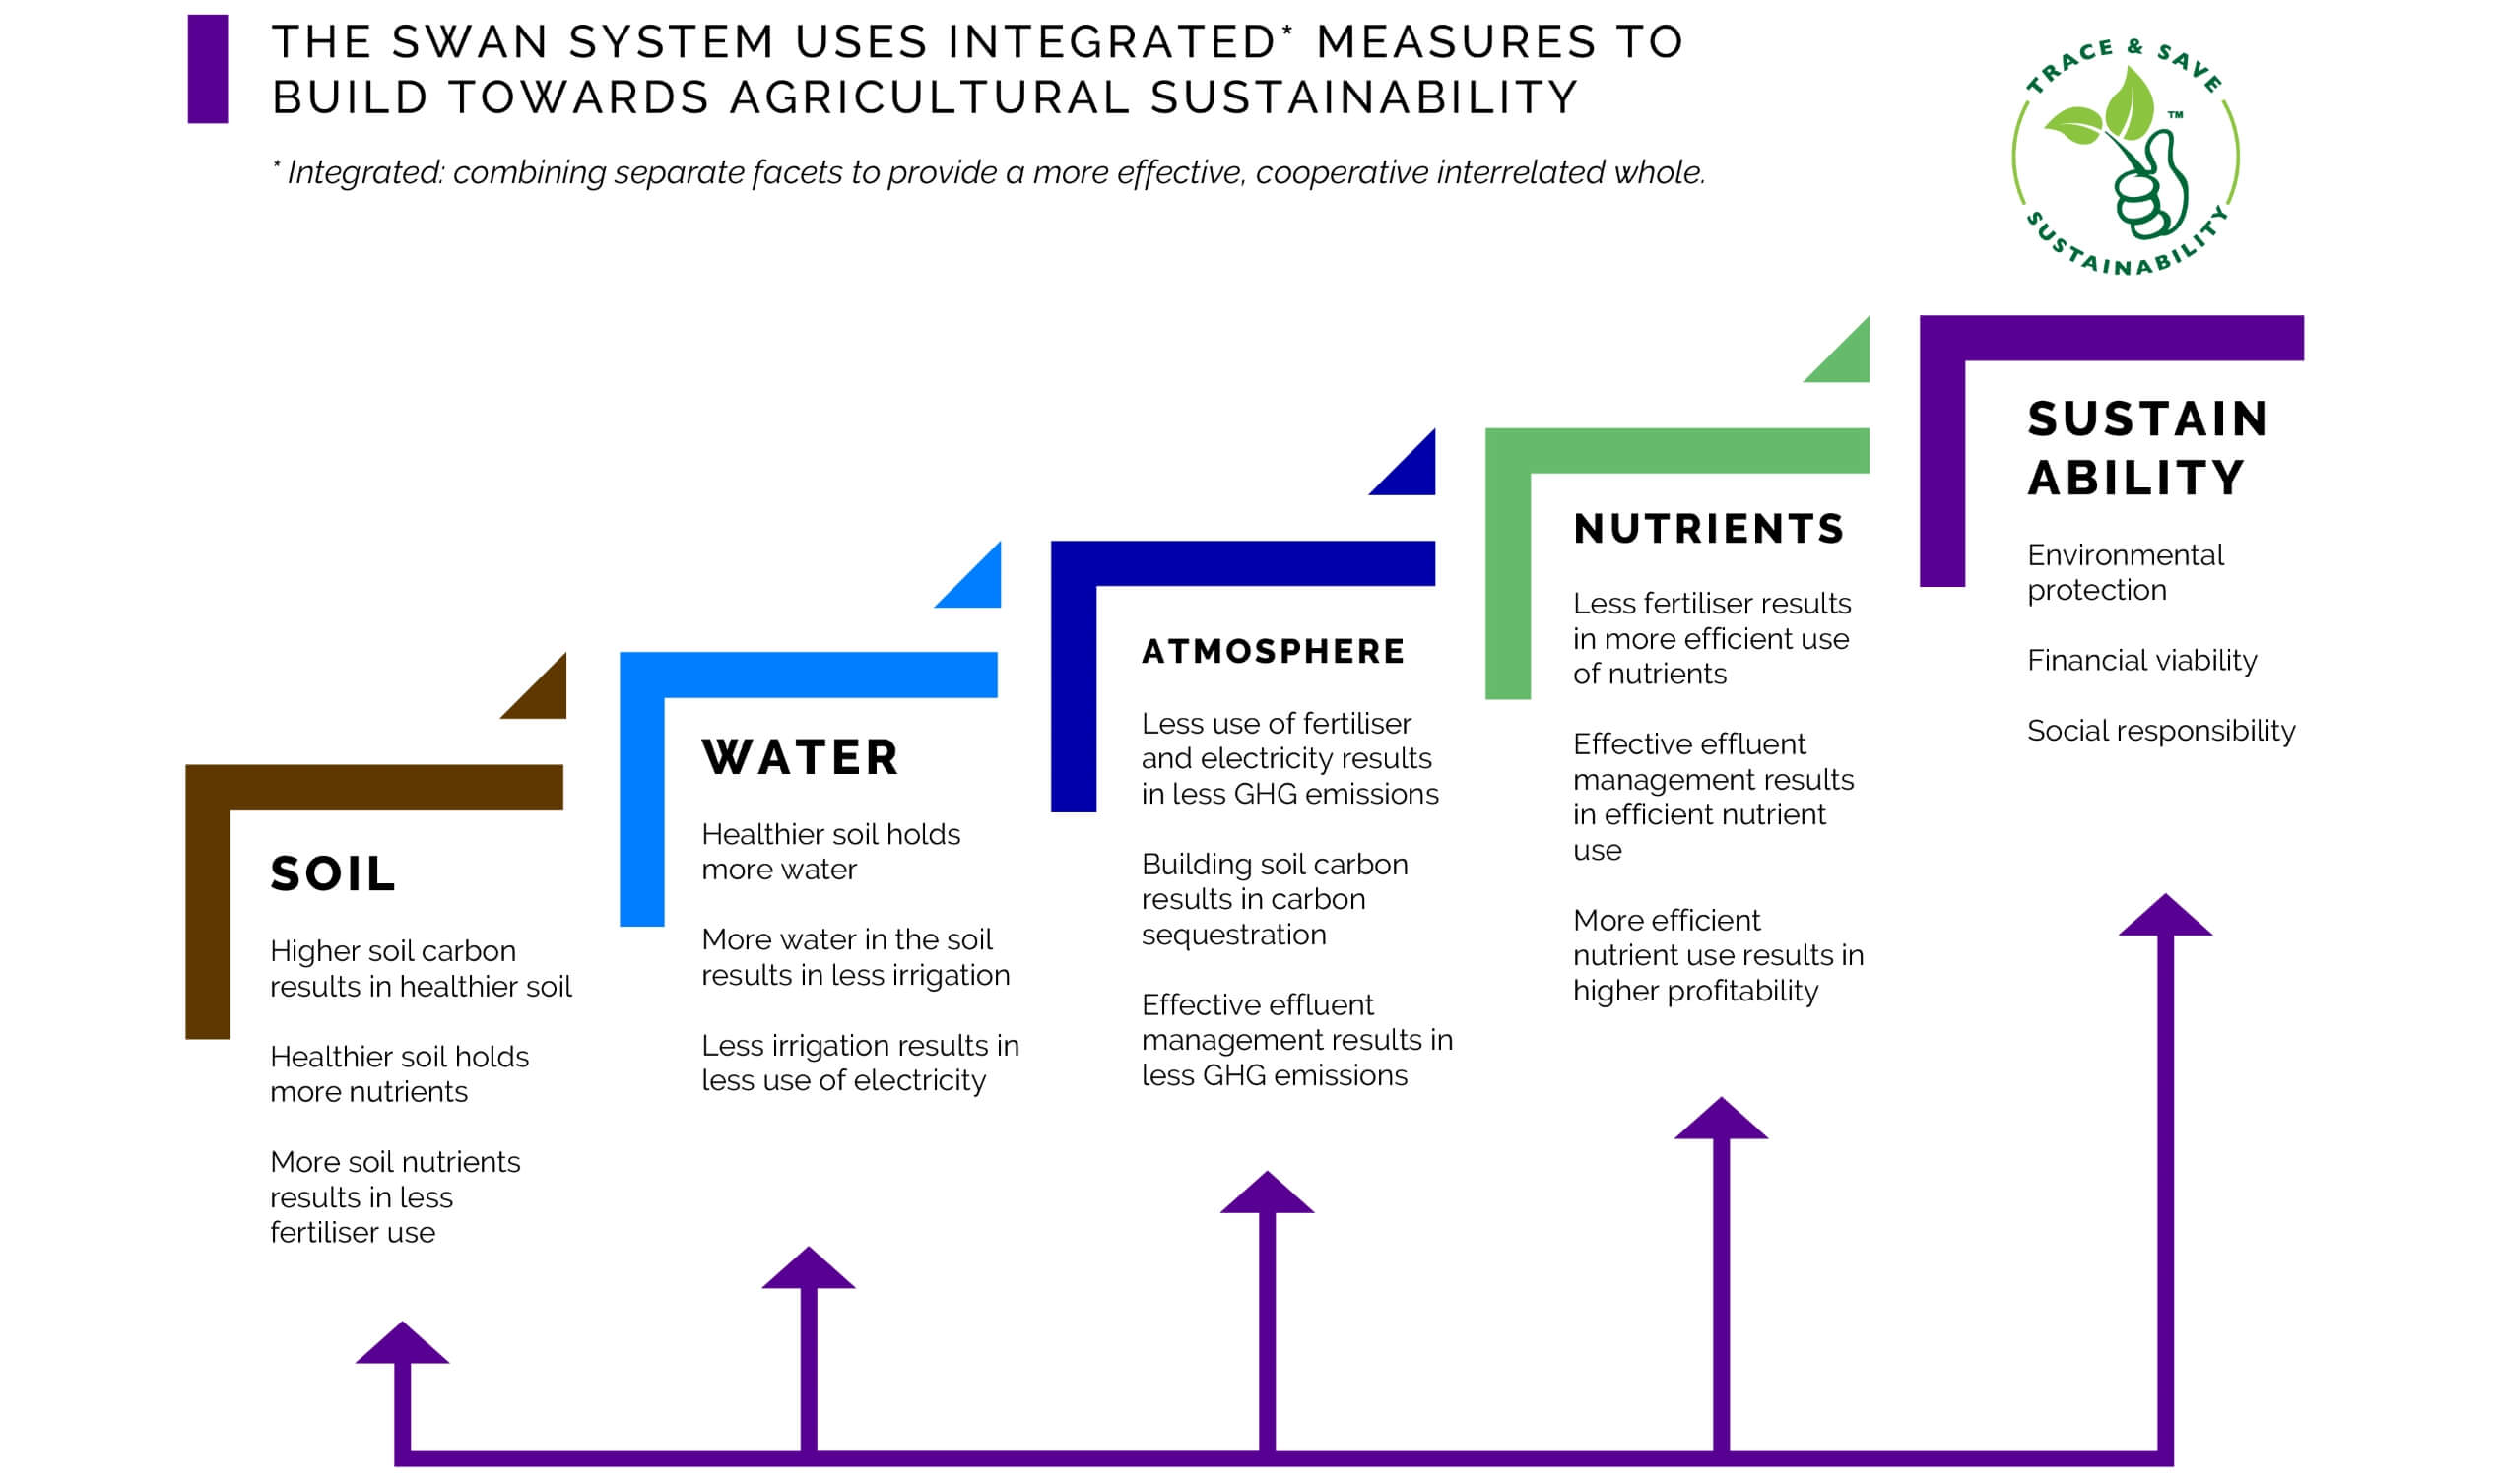
The SWAN system was developed by Trace & Save in order to provide integrated measures of sustainability which assist farmers in assessing whether they are building towards agricultural sustainability. The SWAN system is composed of soil, water, atmosphere and nutrient components.
The best way to show how these integrated and interrelated measures reflect the journey of improving agricultural sustainability is to show a case study of a farm which has become more sustainable over the past five years. This farm is a mixed irrigation and dryland pasture-based dairy farm in the Tsitsikamma.
The measures are not all perfect, but I will explain how and why each measure has been influenced by various management practices which have been implemented on the farm over the past five years.
The drought has also made progress challenging in some areas, but the fact that the farm has been improving through the drought is testament to good management.
Soil
The best place is to start is with the soil. The soil has dramatically improved on this farm over the past five years, due to considerable effort on the part of the farmer to address soil health.
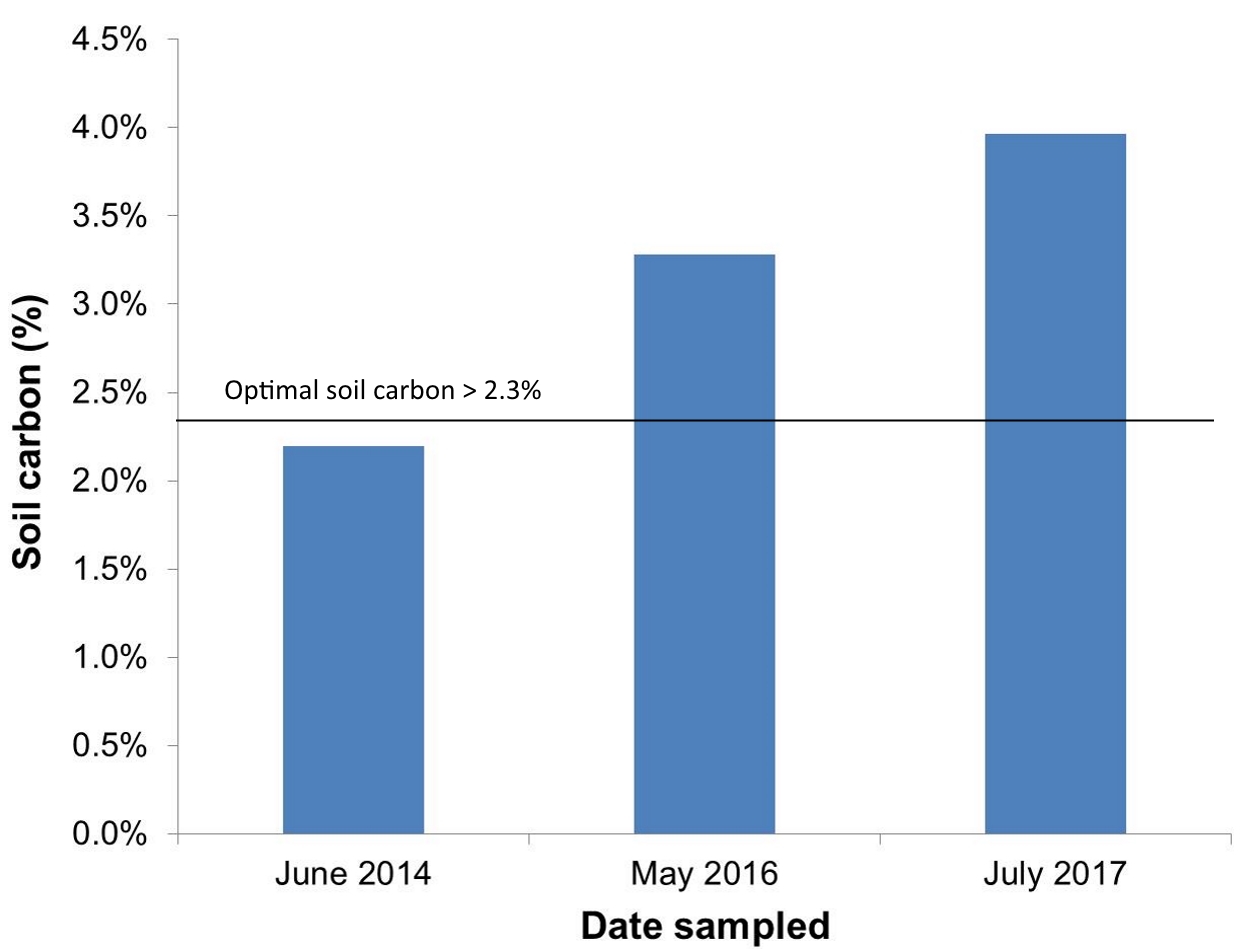
The most comprehensive measure of soil health is soil carbon, and the soil carbon levels on the irrigated areas on this farm have improved from 2.2% in 2014 to 3.96% in 2017. That is significant improvement, and has most prominently been brought about through good grazing management.
By ensuring that pastures are given enough time to grow out between grazing intervals, carbon is added to the soil through the roots. This principal of grazing management is strictly followed on this farm (Read more on grazing management here- Grazing management: The key to sustainable pasture-based farming).
Soil carbon plays a big role in soil life, and one of the indicators Trace & Save uses for soil life is the potential rate of mineralisation. This shows the potential of the soil to convert organic nitrogen to inorganic nitrogen.
On this farm the rate was 524 kg/ha/year in 2014, which improved to 775 kg/ha/year in 2017. This is a lot of nitrogen that can potentially be made available by the microorganisms in the soil and is an indication of the health of the life in the soil on the farm.
Another area of significant improvement has been in soil fertility, which is linked to soil carbon. Carbon increases the capacity of the soil to store nutrients, thereby contributing to improving soil fertility.
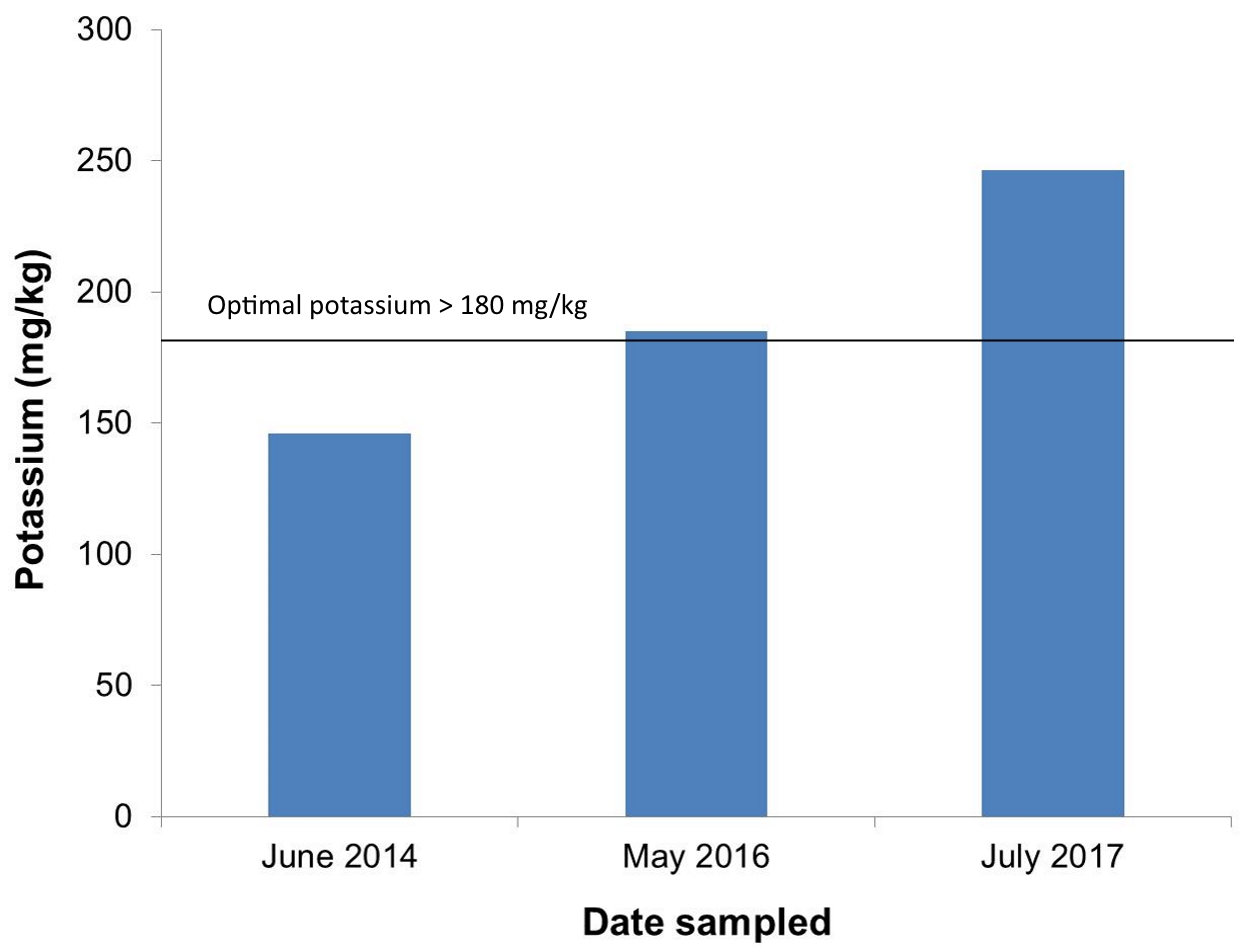
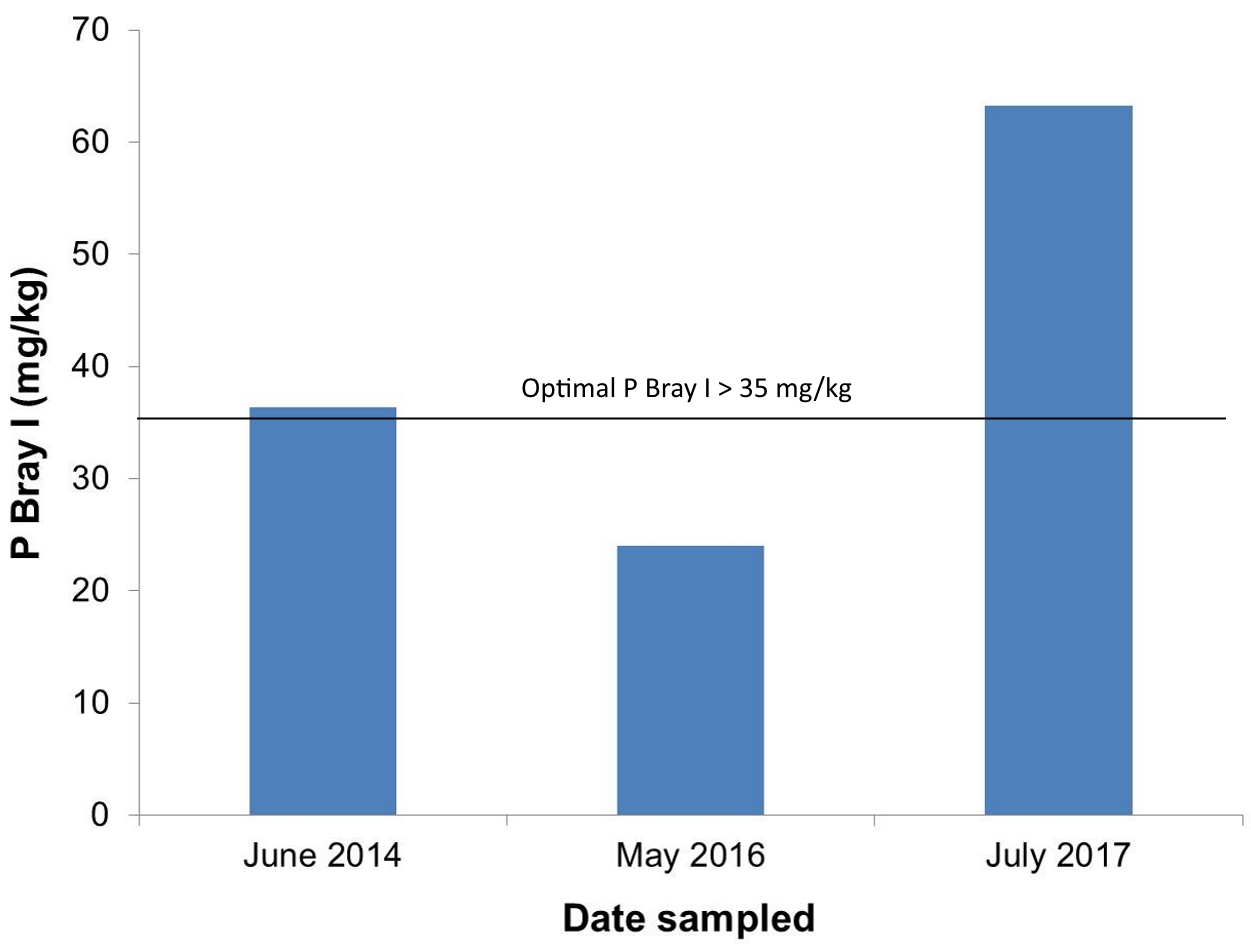
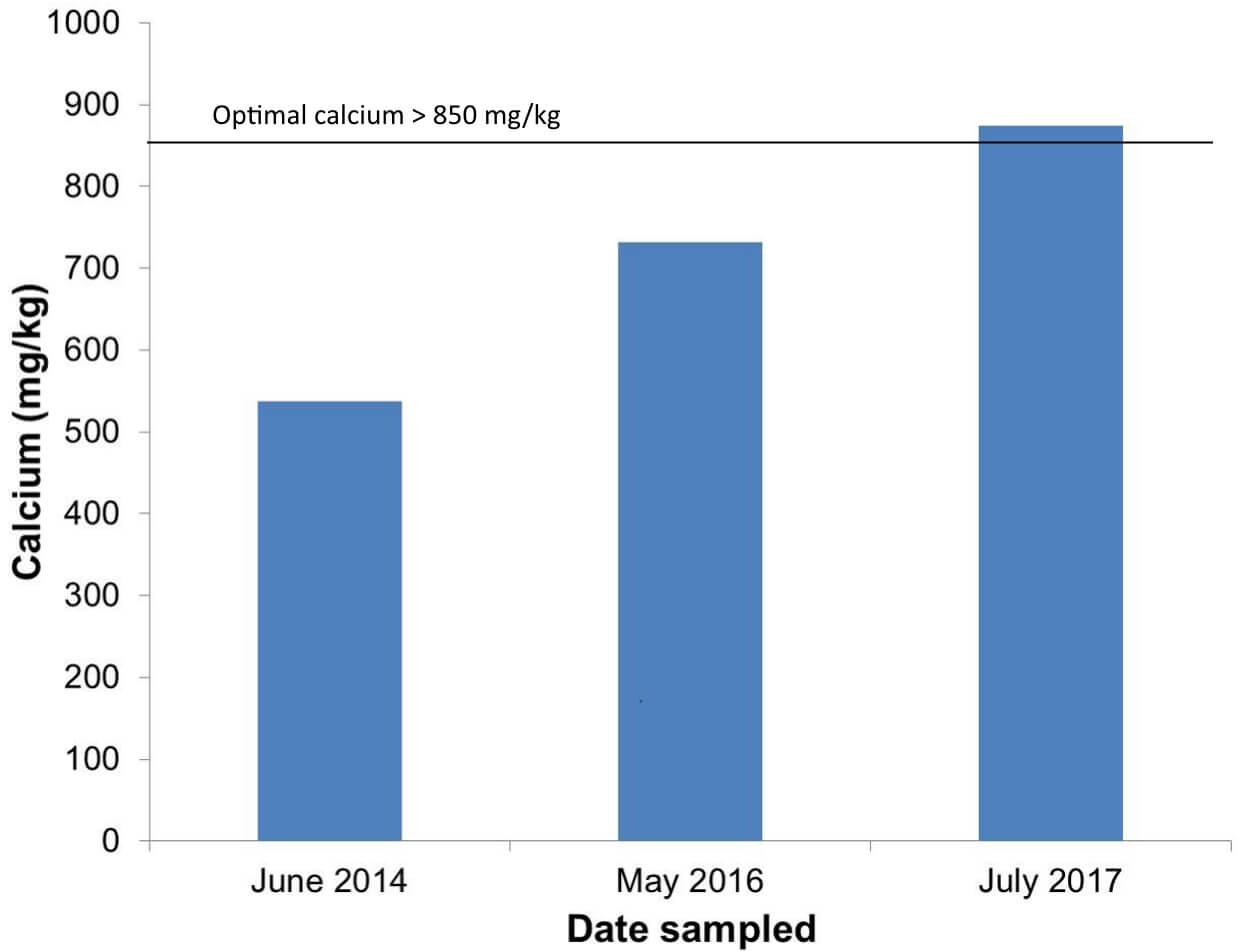
The graphs below show the improvement in phosphorous, potassium and calcium levels between 2014 and 2017. This has resulted from the farmer identifying areas which needed improvement from soil samples, and addressing the lack in each camp.
Calcium has been built by yearly lime applications, and phosphorous and potassium have been built through the application of compost and chicken litter. Although large amounts of nutrients had to be imported onto the farm (which is reflected in the mineral balance results shown below), and at a cost, these improvements in soil health significantly contribute to the farms ability to grow healthy pastures in a sustainable manner in the future, without relying on excessive fertiliser application.
Change in soil carbon levels from 2014 to 2017 on irrigated pastures
Change in potassium levels from 2014 to 2017 on irrigated pastures
Change in P Bray I levels from 2014 to 2017 on good and poor irrigated pastures
Change in calcium levels from 2014 to 2017 on irrigated pastures
Water
The second aspect of the SWAN system is effective water management. The drought has made it difficult to get any accurate idea of how much more effectively water has been used on the farm.
Anecdotally, the farmer mentioned to me that he has seen that the soil holds moisture better due to the improved carbon levels, and therefore he does not have to irrigate as often anymore.
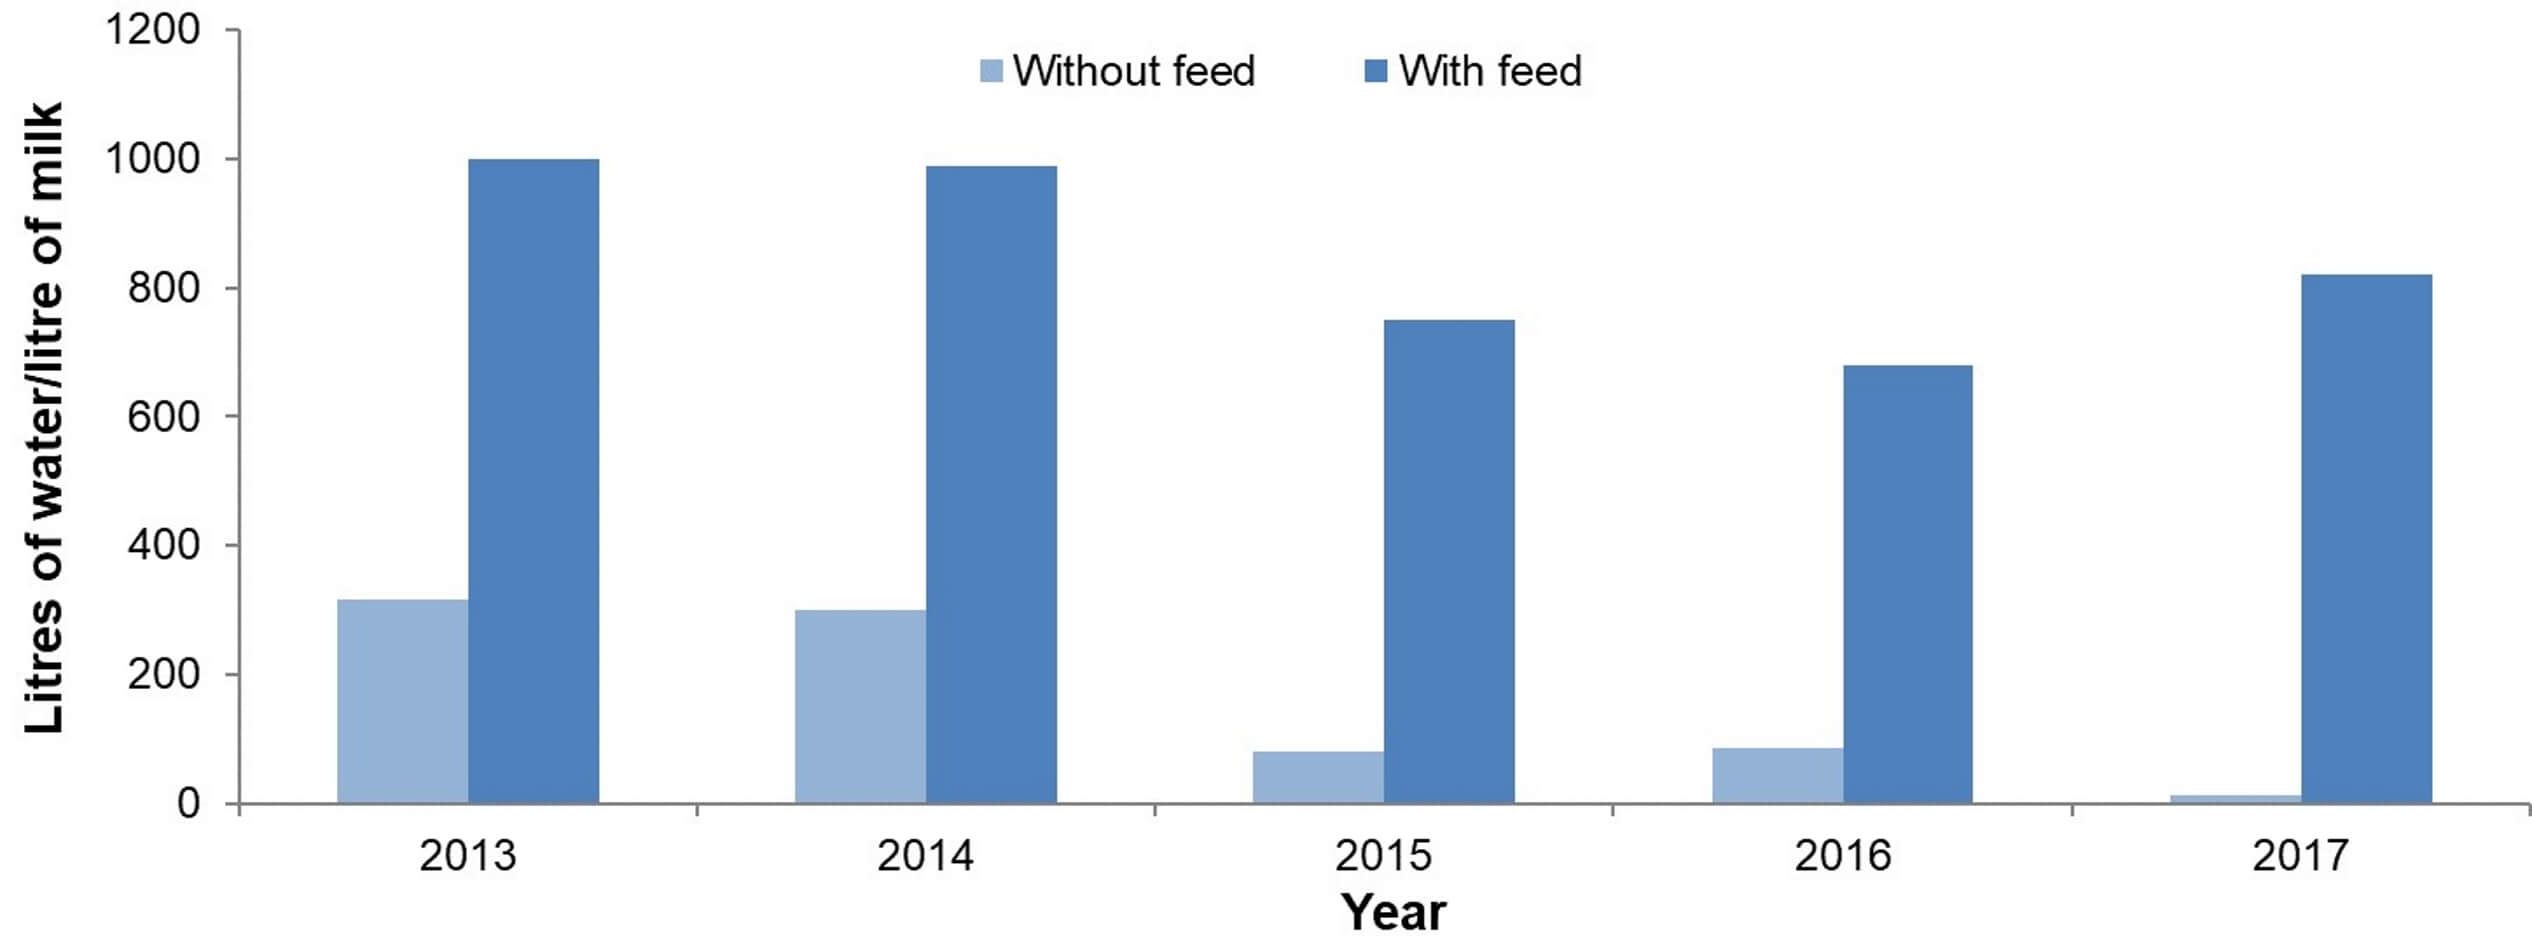
The water use efficiency of the farm has improved significantly over the past five years from 315 litres of water per litre of milk in 2013 to 14 litres of water per litre of milk in 2017. This is mainly due to a lack of water available for irrigation during the drought.
In order to provide a better comparison I have taken into account the feed (concentrates and roughage) which was brought onto the farm, and the amount of water needed to grow these crops. During the drought, where there is less pasture growth, more feed has to be brought onto the farm.
The improvement in water use efficiency, even taking this additional water into account, shows the improvement in efficiency of water management of the farm.
Change in water use efficiency over five years, taking into account the water used to grow imported feed and without taking this water into account
Atmosphere
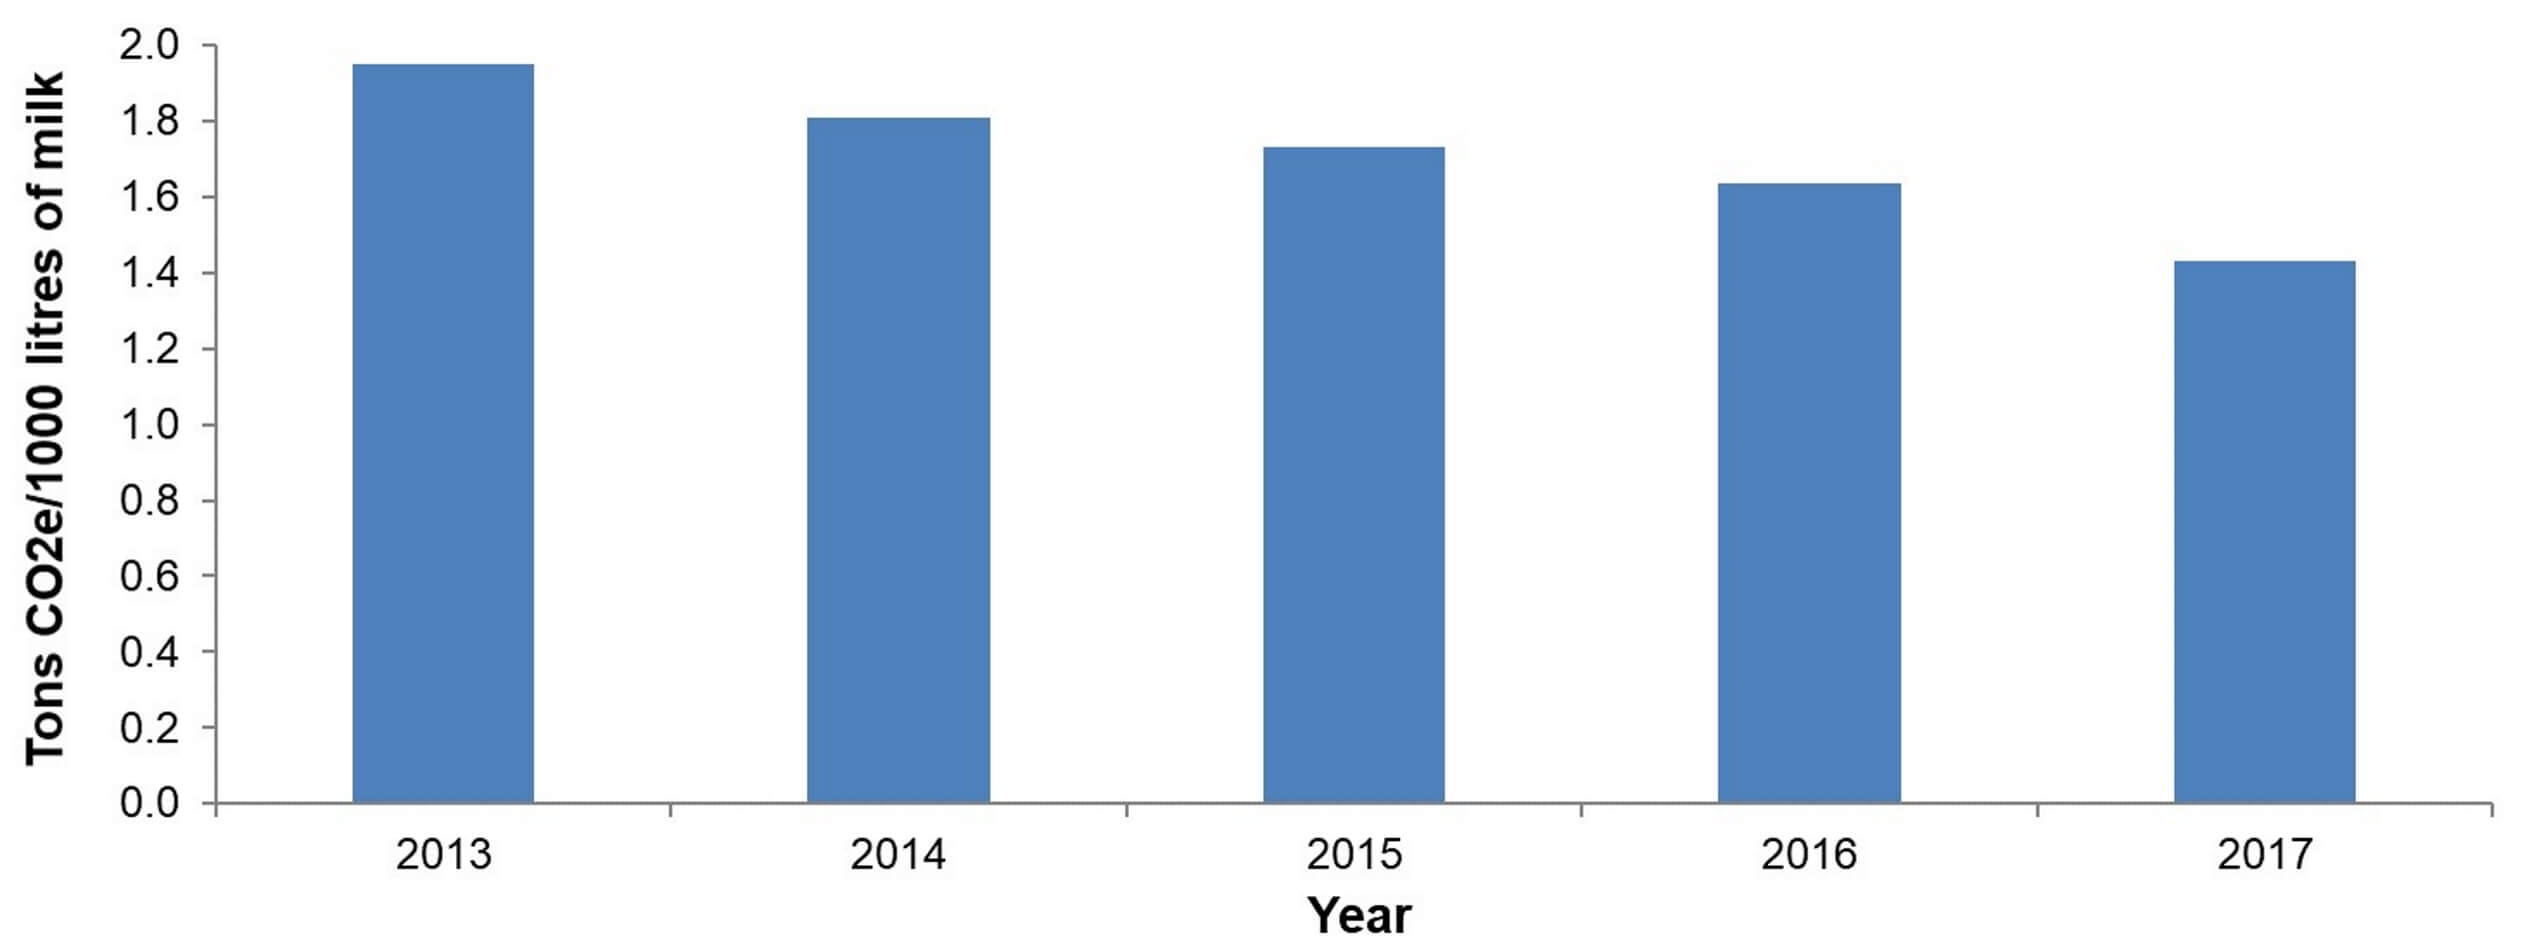
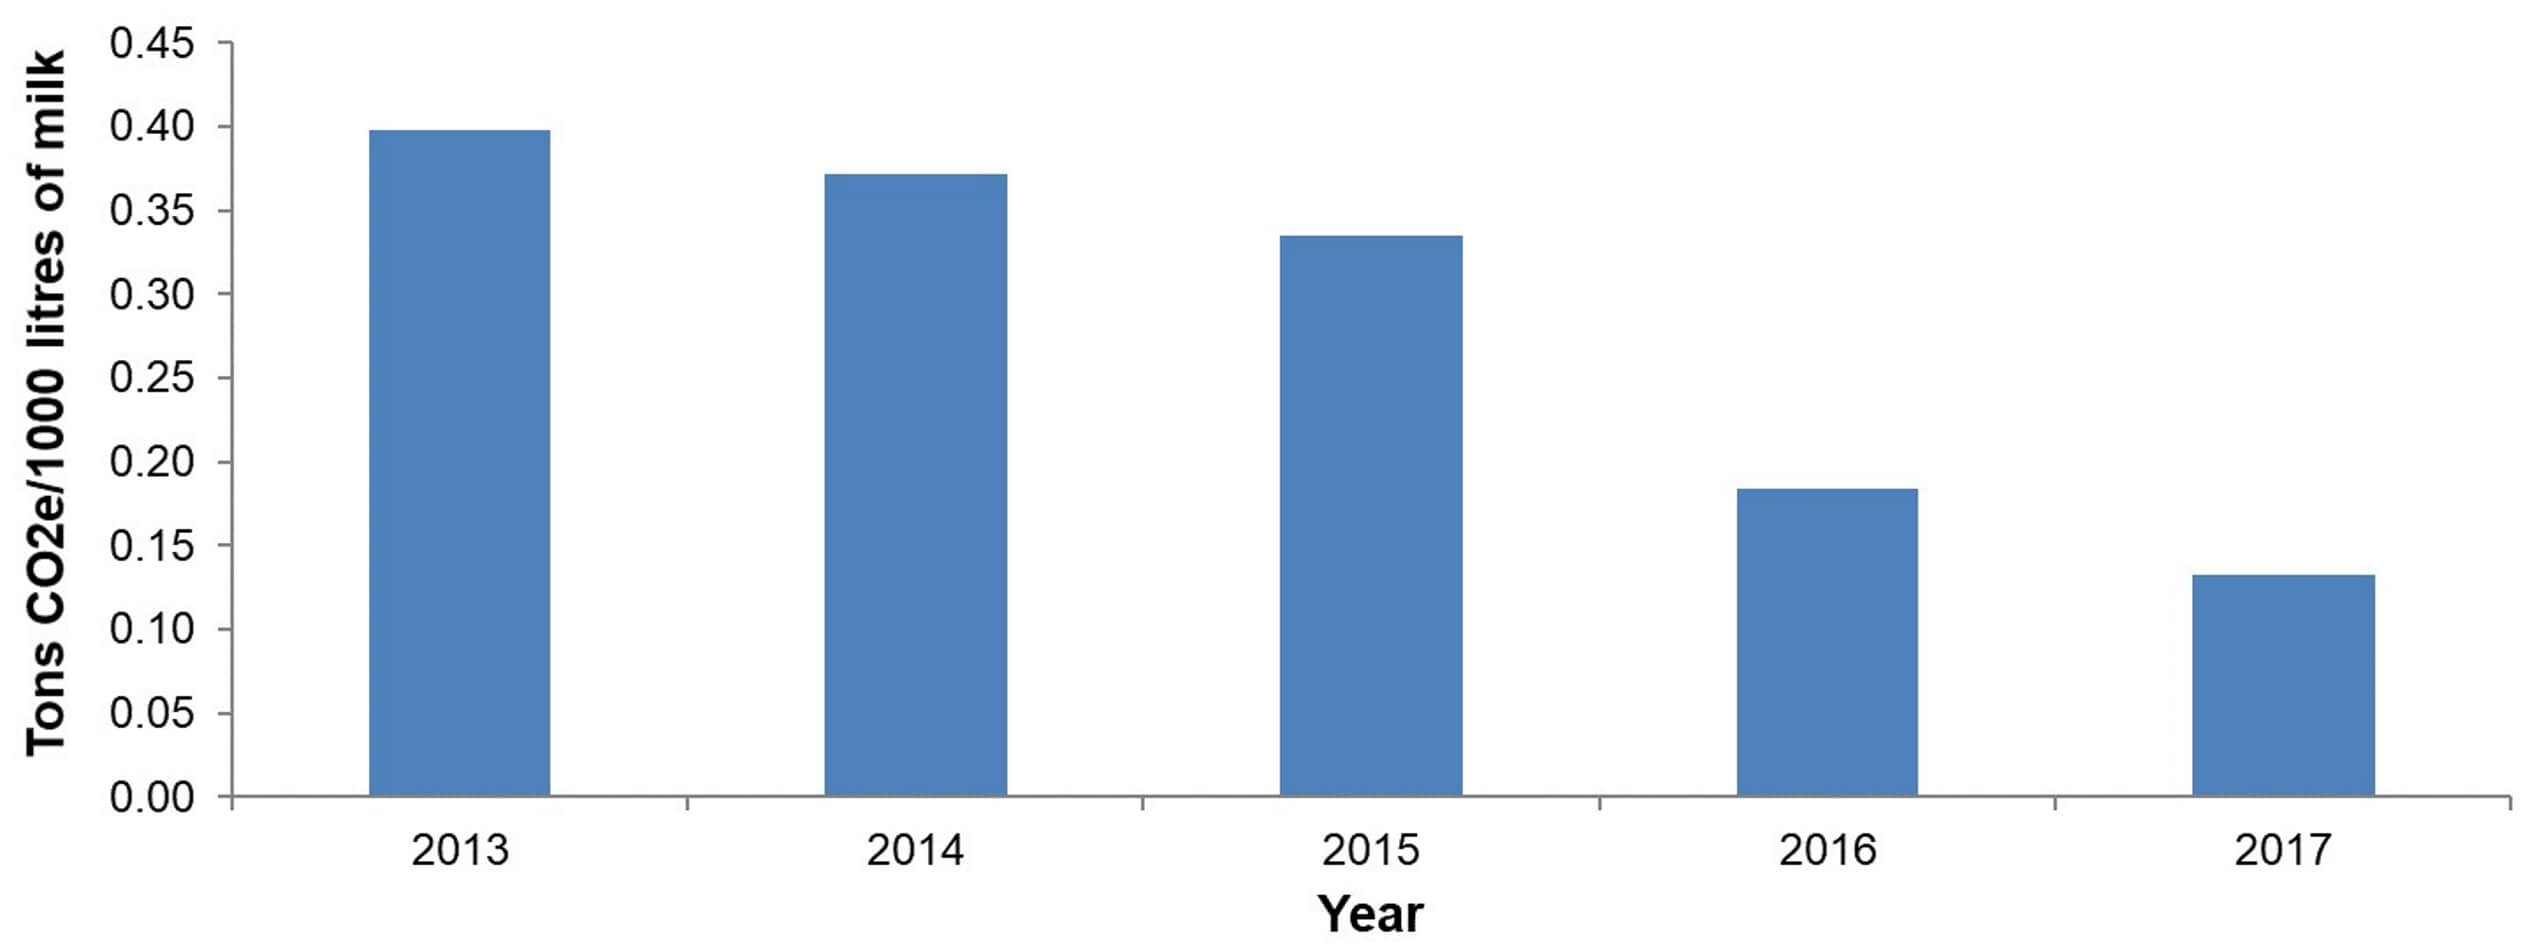
The third aspect of the SWAN system is the atmosphere, which accounts for the greenhouse gas emissions from the farm. This farm has shown significant reductions in the greenhouse gas emissions.
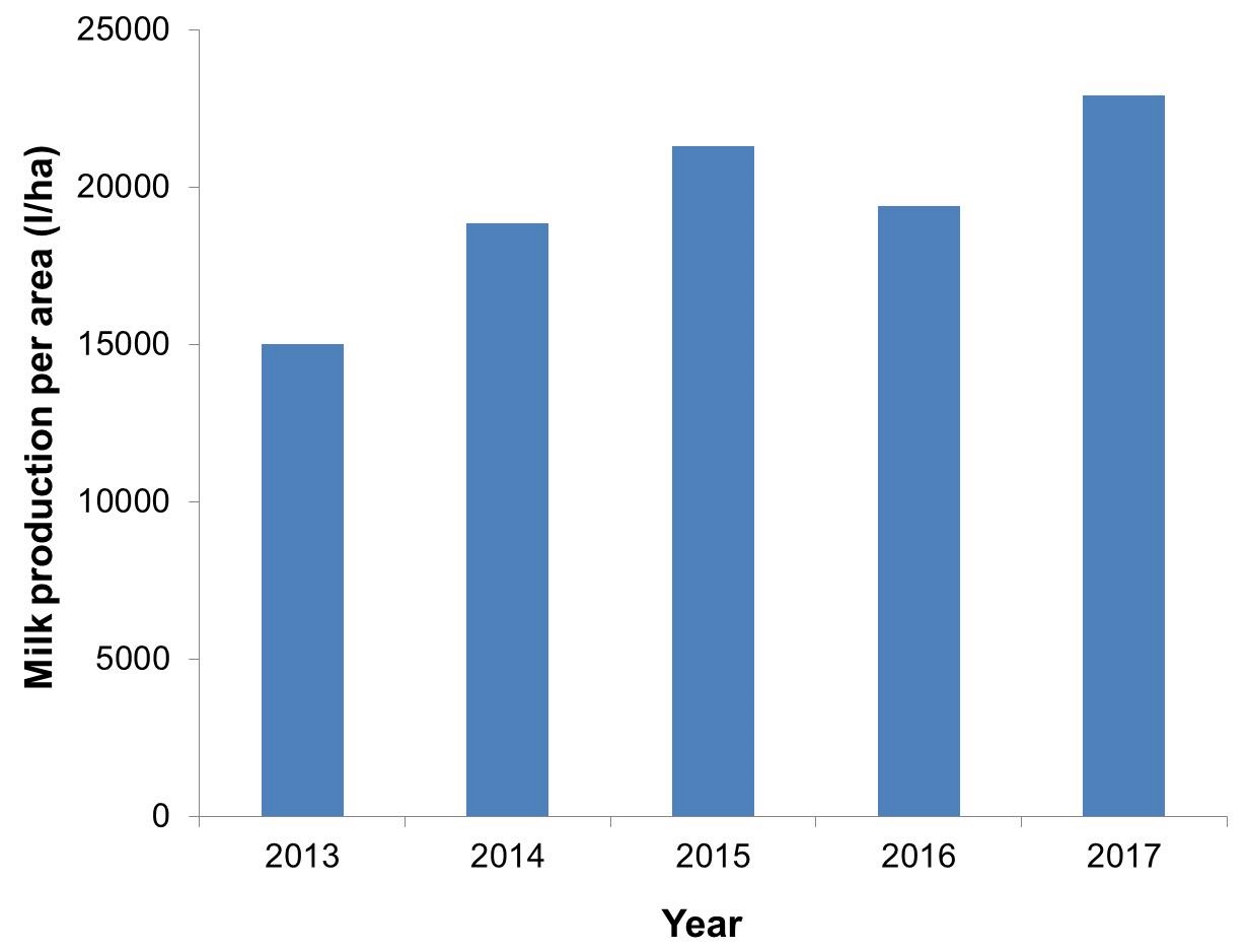
There are quite a few reasons for this. One of the main influencing factors has been the continual improvement in milk production per hectare on the farm, both through increased stocking rates and improved milk production.
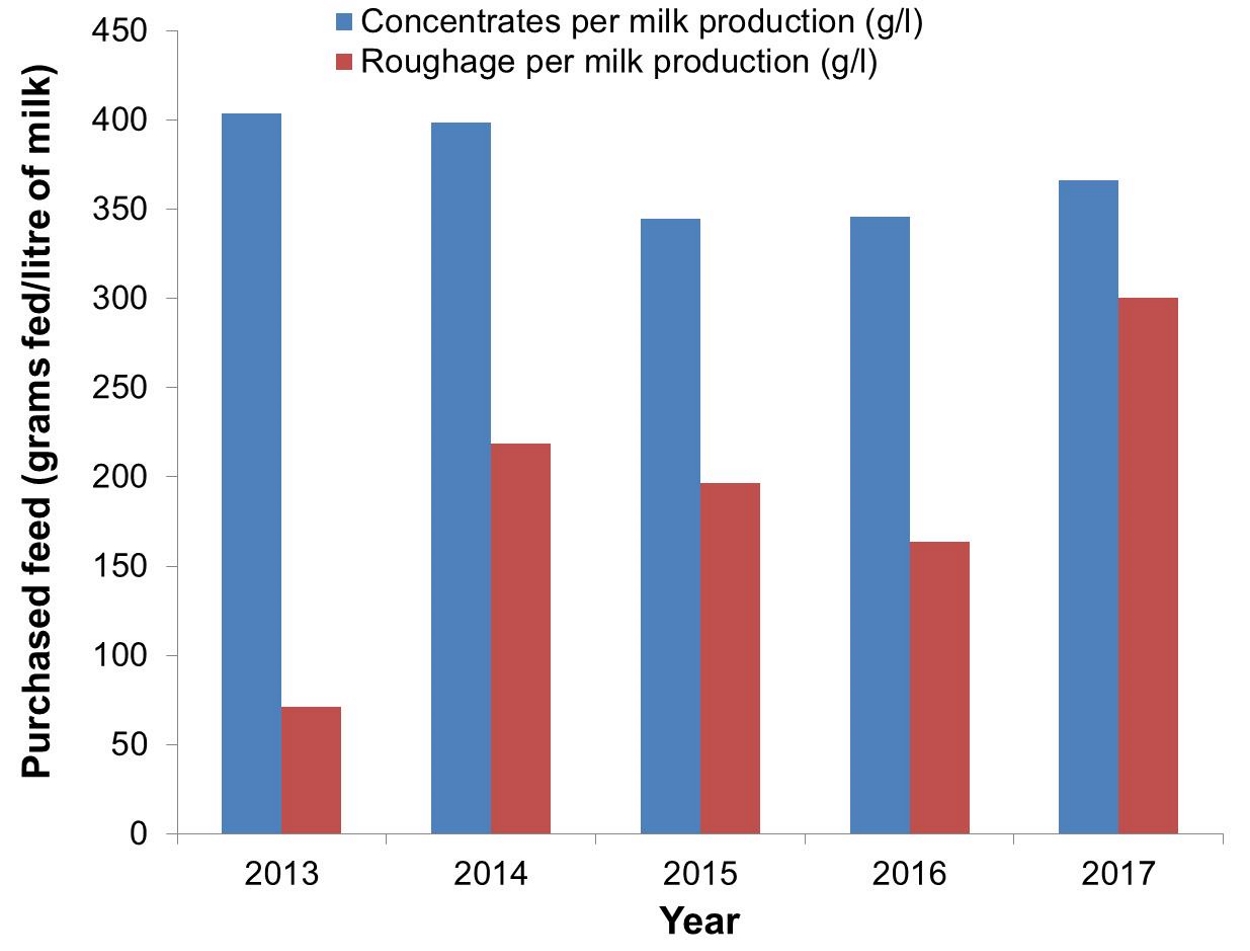
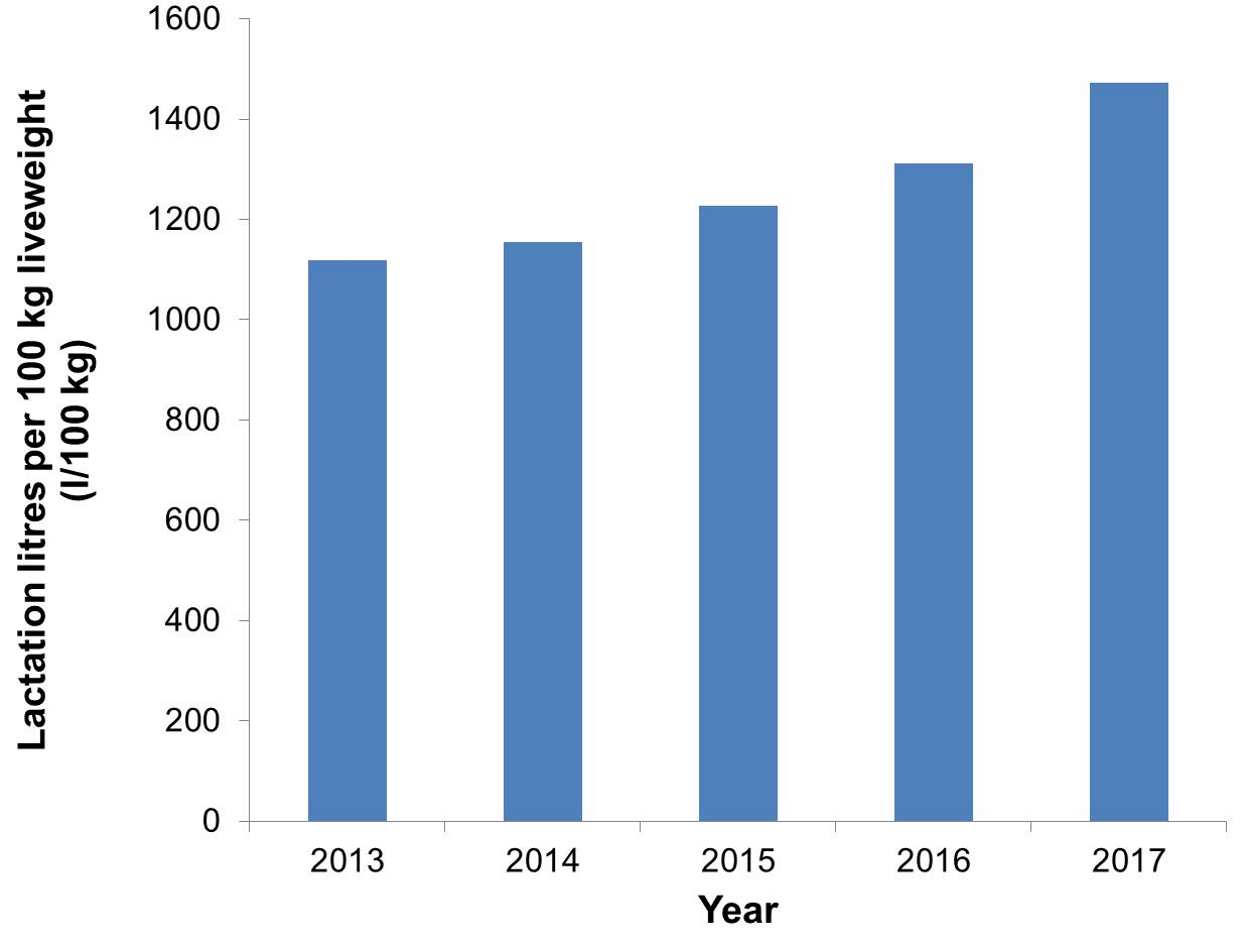
This has been achieved through: 1) improved soil health, resulting in better pasture growth; 2) good grazing management, ensuring the full utilisation of pastures; 3) better feeding practices, ensuring limited wastage and better feed to milk conversion; 4) improved genetics, ensuring better milk production per kilogram live weight.
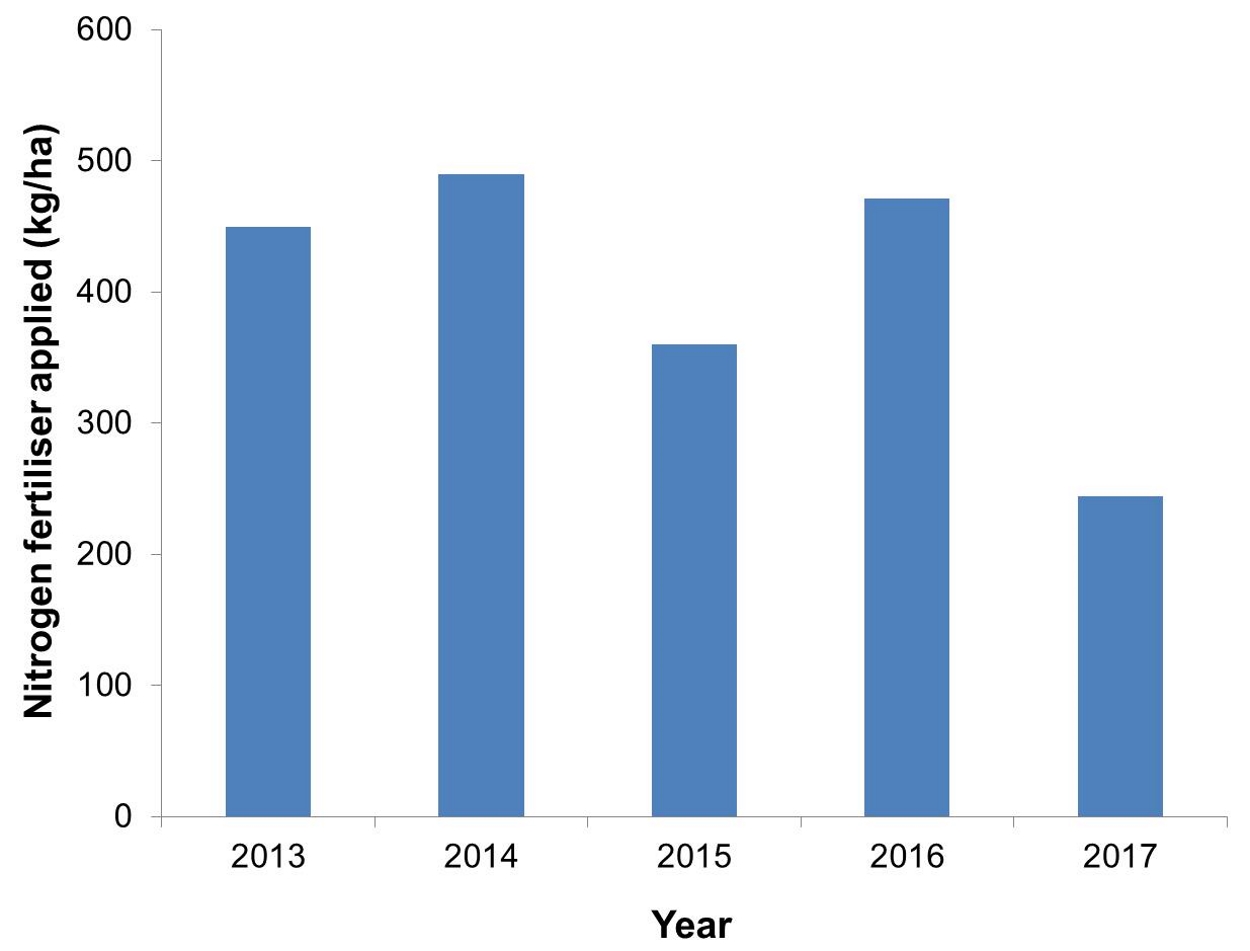
Each of these management areas contributes to more efficient milk production from the available resources, thereby decreasing the amount of greenhouse gas emissions relative to milk production. The evidence of this can be seen in the graphs below.
Change in total greenhouse gas emissions, measured in carbon dioxide equivalents, over five years
Increase in milk production per
hectare from 2013 to 2017
Change in purchased feed fed per milk production between 2013 and 2017
Increase in milk production per 100 kilograms of live weight over a lactation from 2013 to 2017
Reduction in nitrogen fertiliser application
rates from 2013 to 2017
Another factor which has contributed to reduced greenhouse gas emissions is due to improved manure management. There are two main things which have contributed on this farm in this regard.
Firstly, the efficiency of milking time has improved, meaning cows spend less time in the dairy yard and parlour each day. There are much lower emissions associated with dung that ends up in pastures, than dung that ends up in an effluent management system, so if the time that cows spend in the parlour and yard can be limited, the amount of effluent in the effluent management system can be limited.
Secondly, a mechanical effluent separator was installed on the farm in 2015. This separates dairy effluent into a dry matter (which has very little associated GHG emissions) and a liquid that is irrigated regularly (which also has low associated GHG emissions), resulting in lower GHG emissions than the slurry pond system which used to be in operation.
Reduction in greenhouse gas emissions resulting from manure management from 2013 to 2017
Nutrients
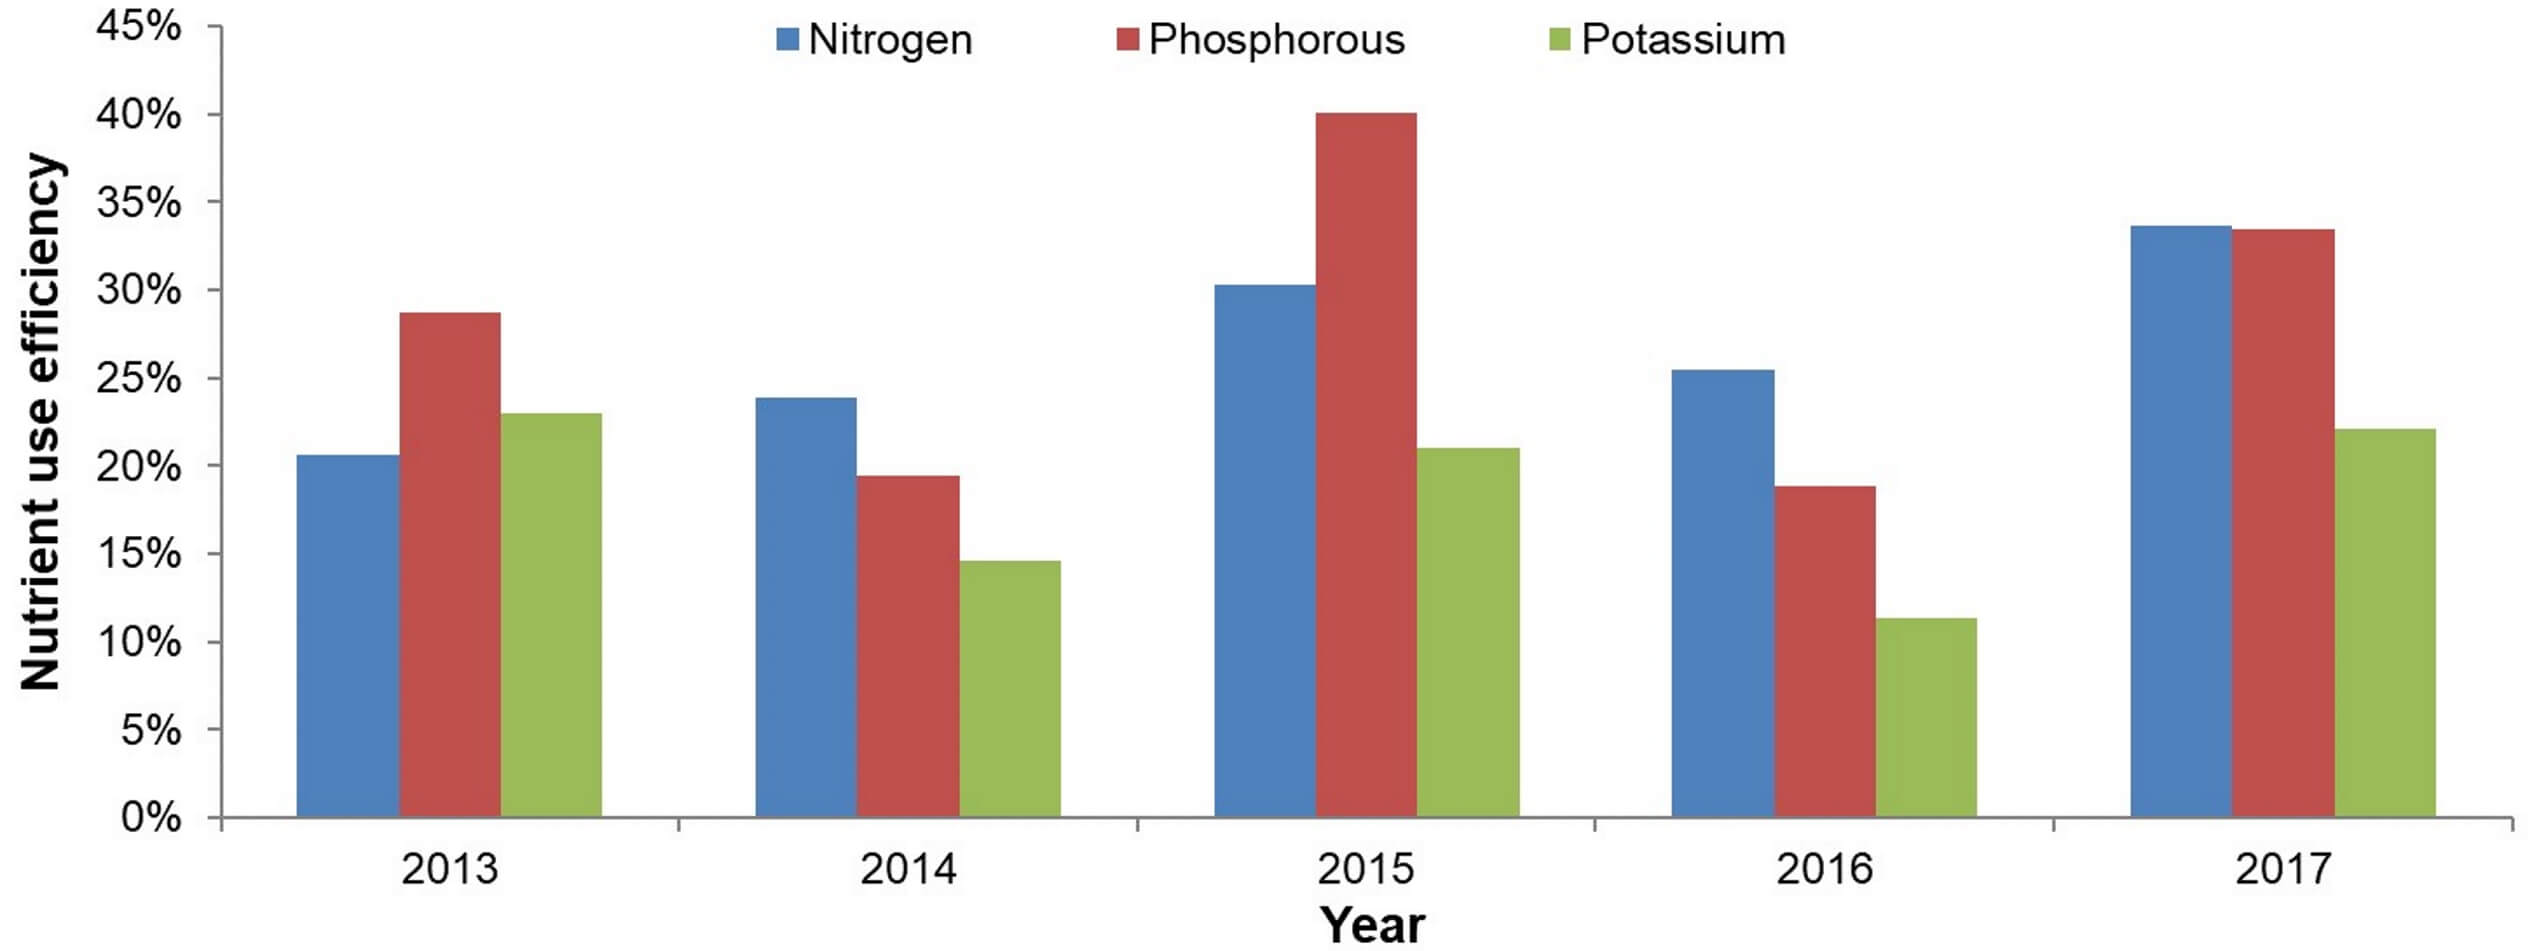
The final aspect of the SWAN system is nutrient management. A mineral balance is used to assess nutrient use efficiency for nitrogen, phosphorous and potassium on the farm each year.
Most of the factors influencing nutrient use efficiency have been discussed already. The improvement in farm efficiency contributes to better overall nutrient utilisation. The reduction in nitrogen fertiliser application rates has contributed to the improvement in nitrogen use efficiency.
The fact that phosphorous and potassium use efficiencies were worst in 2016 was due to the large amount of compost and chicken litter which were applied in order to improve the soil fertility. As can be seen in 2017, these efficiencies improved due to the improvement in soil and therefore there no longer being such a great need for soil amendments.
Nutrient utilisation is still the largest area of opportunity for improvement on this farm, as better nutrient utilisation results in both reduced environmental impacts and greater farm profitability.
Change in nitrogen, phosphorous and potassium use efficiency between 2013 and 2017
Conclusion
There are still many opportunities where this farm can improve. One is to further reduce the amount of fertiliser used (especially nitrogen), now that the soil health has improved.
Soil health can be even further improved, and therefore fertiliser even further reduced, through the planting of multi-species pastures and cover crops, especially including legumes. The farmer has actually already started doing this.
The drought has made reducing purchased feed (concentrates and roughage) challenging, but as environmental conditions improve and pastures start to grow optimally again, the amount of external feed can be significantly reduced. Multispecies pastures and cover crops, with lower fibre and higher energy content will also contribute to an ability to reduce the amount of concentrates fed.
There is also an opportunity to improve irrigation scheduling practices on this farm.
These practices will contribute to the continual improvement of soil health, better water use efficiency, lower greenhouse gas emissions and better nutrient use efficiency over the next few years.
- A carbon footprint assessment for pasture-based dairy farming systems in South Africa - 2024-02-07
- What progress have farms participating with Trace & Save made over the past 10 years? - 2023-09-06
- Carbon footprint reduction over time: Lessons from pasture-based dairy farms in South Africa - 2023-09-04
