A previous blog (See your farm as a system) has discussed nutrient cycling and management on dairy farms, but how does this actually happen in practice. In this article I would like to break down some practical examples of how nutrients move around a dairy farm. The numbers used are not exact and this is a very simplistic model of a farm, but they are a pretty good estimate. I believe the exercise below provides insight into the opportunities which dairy farmers have to reduce nutrient waste, thereby reducing costs and in-turn reducing the negative environmental impact of their farm. This article deals specifically with nitrogen (N), which is the most used nutrient on dairy farms, but the principle is true for other nutrients, especially phosphorous and potassium, as well.
Sources of nutrients in the farm system, and specifically to the soil
Fertiliser
Fertiliser is the most obvious source of nutrients to the soil. These can be in the form of chemical, synthetic fertiliser (e.g. urea), or in the form of organic fertiliser (e.g. compost). There are positives and benefits to both forms, which are discussed in more detail in other blogs. The focus in this article is the total amount of N being imported onto the farm. Purchased fertilisers are a significant source of N into the soil. Fertiliser rates vary greatly, so I have used 150, 300 and 450 kg N/ha/year, with corresponding pasture growth of 15, 17.5 and 20 tons/ha/year. There is obviously a lot more than fertiliser N which influences pasture growth, but these various N application rates and pasture growths are a representation of different systems. The goal of this article is to show that lower fertiliser rates can actually result in higher pasture growth.
Feed and pasture
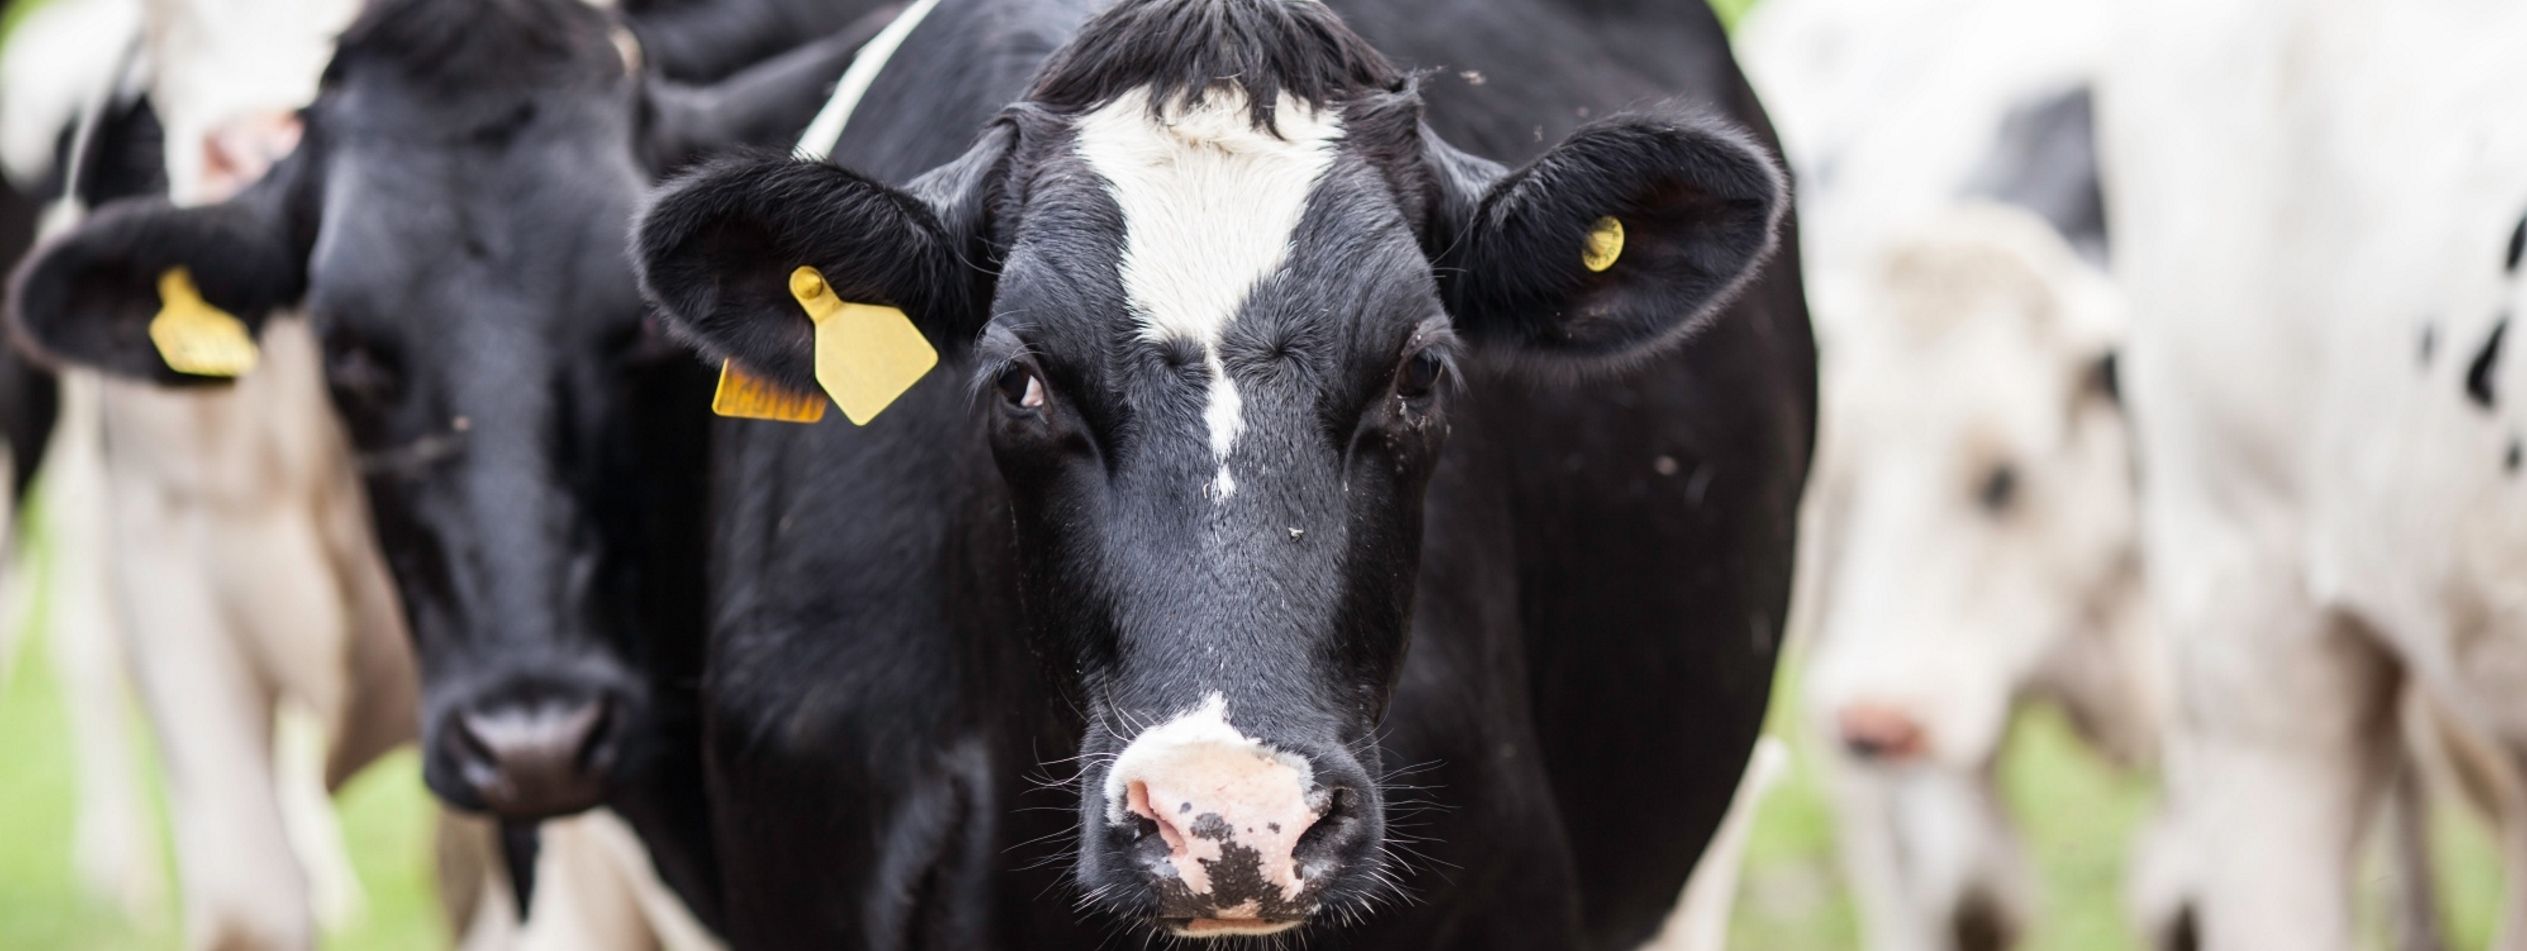
Bought feed is necessary on a dairy farm to support animal growth and milk production. An average stocking rate on high production pastures is around 4 cows in milk per hectare. Using an estimate of 6 kg of 10% concentrate fed per cow per day, that would result in 140 kg of N imported in concentrates per hectare each year. At least another 15 kg of N can be added from supplementary roughage sources as well. Taking into account N used by the cow for milk production, pregnancy, maintenance and growth, an estimated 70-80% of N taken in as food is not utilised by cows1, and therefore is returned to the soil in the form of excreta. I will work with a conservative estimate of 70%. This is a source of N from both the bought feed, as well as the pasture which the cows eat. Using an average of 3.5% N in pasture grass, it is therefore also possible to calculate how much of this N from pastures grazed is returned to the soil via excreta.
Mineralisation
There are large amounts of N even in poor soils. The majority of this N (approximately 98%) is organic and therefore not available for uptake by plants. The remaining ± 2% is inorganic, mainly in the forms of ammonium and nitrates, and is available to be utilised by plants2. The amount of inorganic N which is available in the soil is influenced by the extent to which soil organisms decompose and break down the organic sources. This process is called mineralisation. The mineralisation rate can vary greatly depending on factors such as soil health and climatic conditions, but 100 kg N/ha/year is a conservative estimate for relatively healthy pasture soils.
Legumes
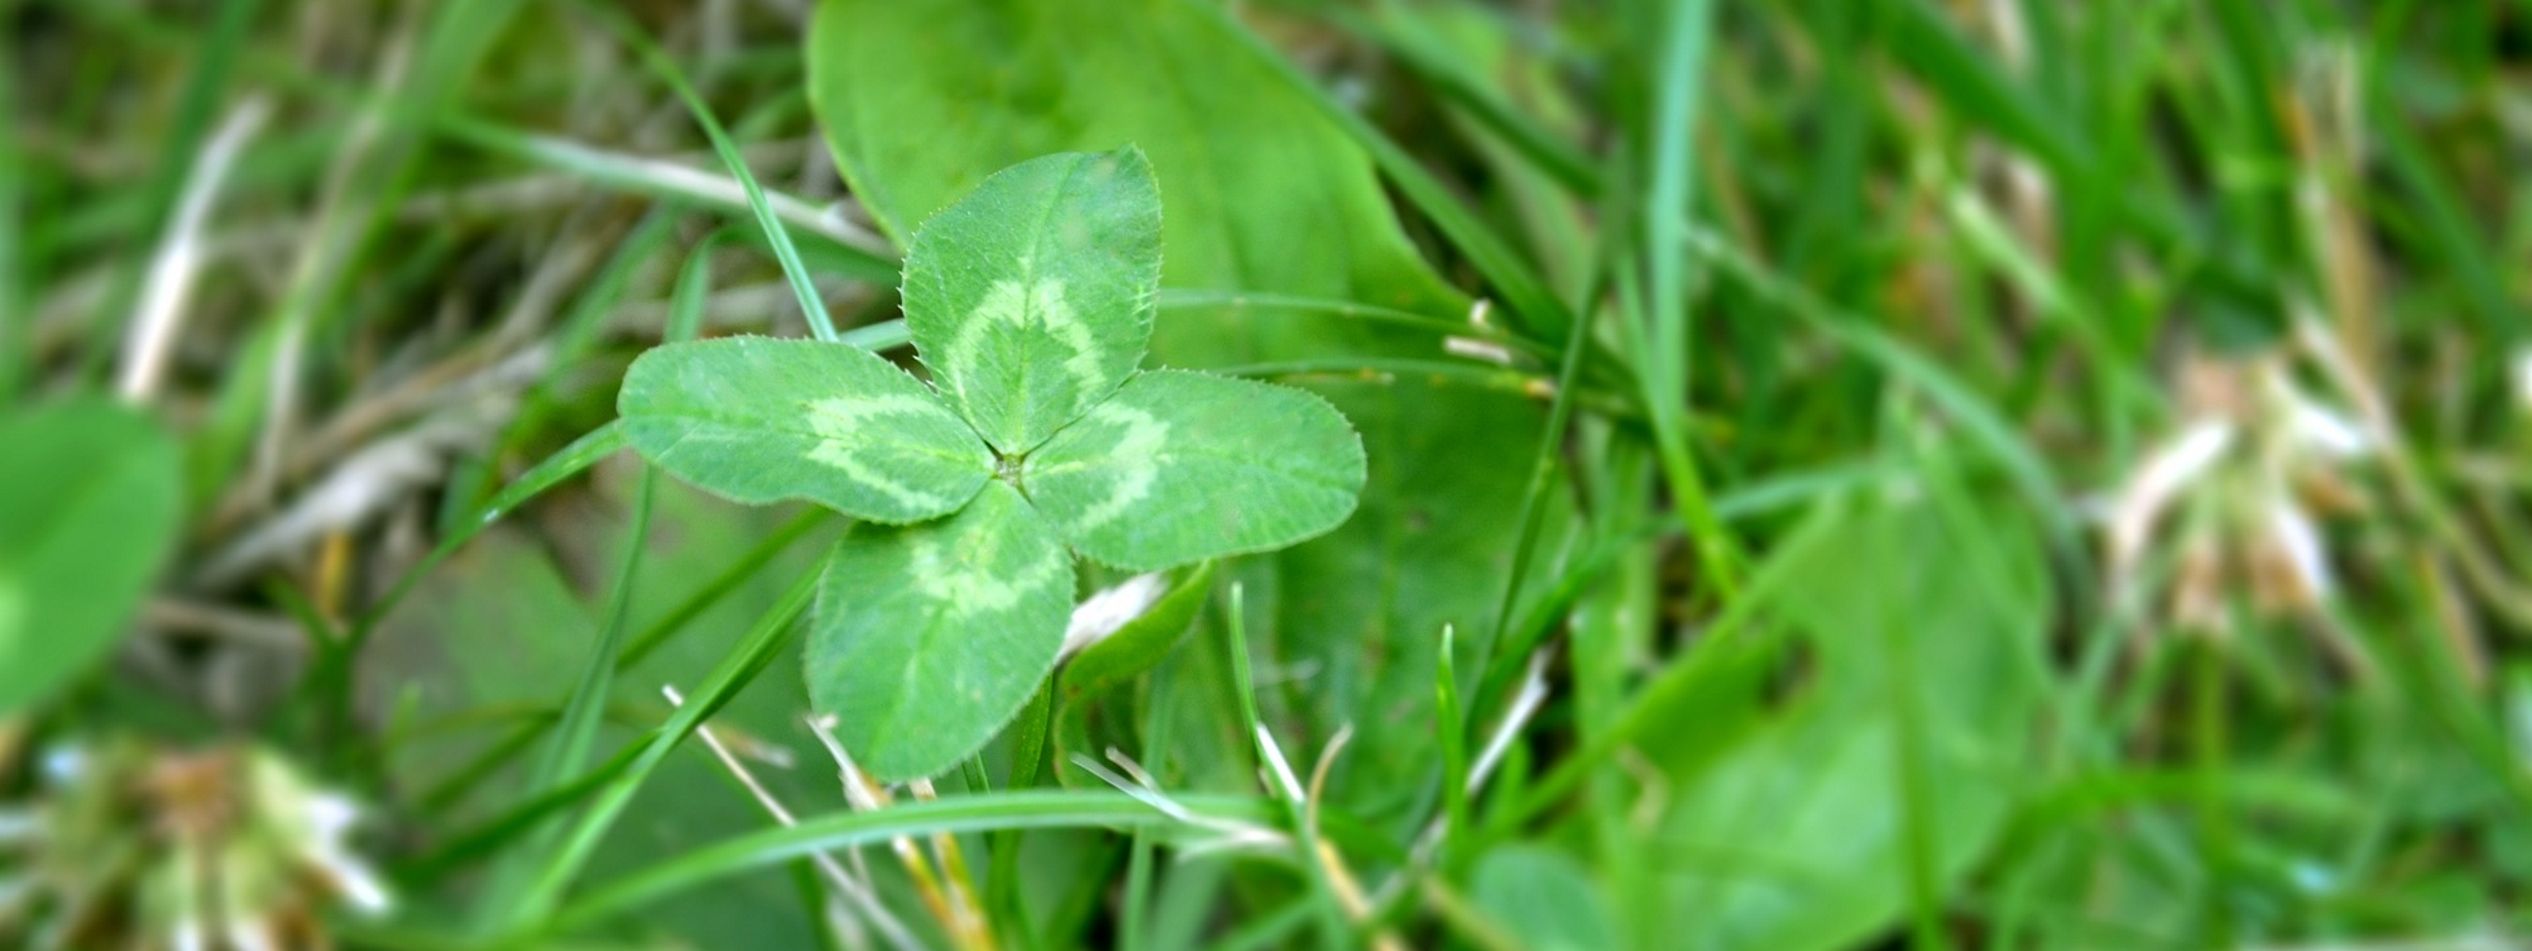
Legumes are plants which have N-fixing bacteria in nodules on their roots. This means that where legumes are planted in pastures, as well as being good quality forage, they also assist in N being transferred from the atmosphere into the soil. Studies have found clover to deposit between 79 and 212 kg N/ha/year. This is largely influenced by the percentage of clover in the pasture, and by the rate of fertiliser application3. Other sources say that 30% clover in a grazing pasture can fix around 150-200 kg N/ha/year4. For the purposes of this exercise, I will use the conservative estimate of 80 kg N/ha/year.
Atmospheric deposition
Nitrogen is deposited during rainfall, especially thunderstorm events. The amount of N deposited in this manner is largely variable, and difficult to predict or calculate. That said, it can be up to, and above, 20 kg N/ha/year.
Losses of nutrients from the farm system
Grazing and milk production
Nitrogen is removed from the farm system in the form of milk, and the majority of this N on pasture-based dairy farms is from pasture. The original source of this is the soil. Nitrogen is therefore removed through grazing, relative to the amount of pasture grown.
Gaseous loss
Nitrogen is not a very stable element, and has many different forms in the environment. An example of these forms is what is discussed above about the organic and inorganic forms in the soil. Another example is that N in the form of ammonium (urea in urine and urea fertiliser is rapidly converted to ammonium in the soil) can be converted into ammonia gas. This is known as ammonia volatilisation. This process causes N from the soil to be lost to the atmosphere, as it is converted into a gas. There are many factors influencing this, including season and climatic conditions, but a yearly estimate of 25% loss of N in urine through volatilisation is assumed5. With regards to the volatilisation of N from fertiliser, the type of fertiliser, soil conditions (especially pH, moisture and temperature), the manner of application, crop residue, the amount of water applied post fertiliser applications and the climatic conditions all influence the extent to which volatilisation takes place6. An estimate of yearly volatilisation rates of urea, which is the most common form of N fertiliser used, on irrigated pastures is around 10%6,7,8.
Another process which results in the loss of N is through the conversion of nitrates to nitrous oxide gas. This is called denitrification. This usually only occurs when soils are waterlogged8. Denitrification also causes the loss of N from excreta, especially in slurry dams on dairy farms. I have factored in an estimated loss of 5%, because a small fraction of the excreta on a farm ends up in slurry dams, and soils are not often waterlogged. A loss of 30% of the N excreted by dairy cows in dung and urine is therefore estimated due to the transformation of ammonium and nitrates into gaseous forms.
Leaching
Another manner in which N is lost is also linked to the mineralisation process. When ammonium is converted into nitrates, the N becomes very soluble in water. When there is high rainfall, or large amounts of irrigation are applied, water moves through the soil profile, and with it moves nutrients, like nitrates, beyond the root zone. This is called leaching. Leaching is influenced by the extent to which water moves out of the root zone. There are two main things which affect this: the amount of water added to the soil through irrigation and rainfall, and the ability of the soil to hold water. The water holding capacity is most significantly influenced by the texture, structure and carbon levels of the soil5,9. Due to all of these factors, estimating the average loss of N through leaching is challenging. Due to some of the N which is returned in excreta already being in liquid form (urine), it can be assumed that some of this will move below the root zone. I have accounted for a 10% loss of N from excreta and fertiliser due to leaching, although I believe this is an overestimate, and can be easily limited by farmers through good practices.
Walkways and roads
I used an estimate of 16% of the nutrients from animal excreta being lost of walkways and roads. This is an overestimate, just to make sure this loss is sufficiently taken into account, even on farms where animals walk long distances to the parlour and back.
Overall soil balance
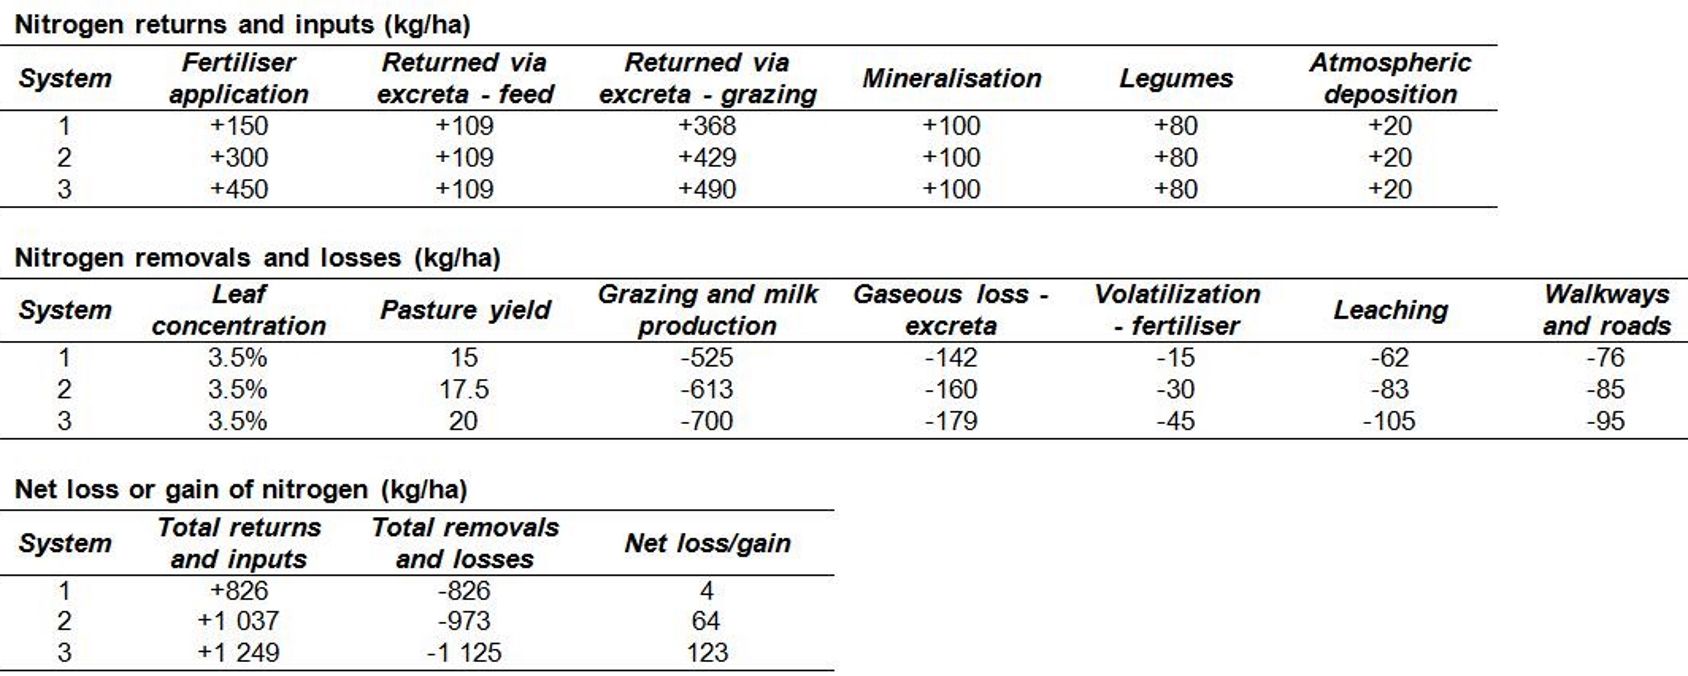
Taking into account the N removals and losses mentioned above, and the N which is returned and inputted into the soil, the tables below provide an overview of what is happening to N in a pasture-based dairy farm system. As can be seen in the tables, even with the example using a very small amount of N, from a South African perspective (150 kg N/ha/year), there is still a net gain of 4 kg N/ha/year. In the example where 450 kg N/ha/year is applied, taking into account the assumed increase in pasture production, there would be a gain/excess of over 120 kg N/ha/year. This just seems like a large waste of money to me. Taking an average farm of 250 ha, and a cost of nitrogen of R10/kg, then this would mean a waste of R307 500 a year. Even more can be saved if the amount of loss from volatilisation, denitrification and leaching is limited. The other factor, is that this excess, on top of the N already lost through gases and leaching, causes a significant negative environmental impact.
Opportunity
The main purpose of this blog is to point out the opportunity which exists for nitrogen to be better utilised on pasture-based dairy farms. As can be seen from the examples, there is a lot more nutrient cycling taking place than just what is put into the soil through fertiliser, and taken out in grass and eventually milk. In order to develop a more efficient nutrient cycling system, farmers have to take into account the various losses and sources of nutrients. They should ask how they might be able to limit losses where possible. They should then examine what the various sources of nutrients are on their farm, asking how they can increase the ones which are cheaper and more environmentally beneficial, and reduce those which are expensive and harmful to the environment. The major opportunity in this regard is nitrogen mineralisation in the soil. The estimate of 100 kg N/ha/year provided through mineralisation is a very conservative estimate for healthy pasture soils. If farmers focus on improving soil health, and facilitating soil life which will continuously mineralise nitrogen in the soil, this input can easily become in excess of 250 kg N/ha/year. Think about how that could revolutionise the use of nitrogen fertiliser, and how it can free farmers from relying on expensive and environmentally detrimental chemical fertilisers.
References
- Dairy Australia. Perennial ryegrass management VI. Management of P, K and S
- Meysner T, Szajdak L & Ku J. 2006. Impact of the farming systems on the content of biologically active substances and the forms of nitrogen in the soils. Agronomy research 4(2): 531–542.
- Ledgard SF, Sprosen MS, Penno JW, Rajendram GS. 2001. Nitrogen fixation by white clover in pastures grazed by dairy cows: Temporal variation and effects of nitrogen fertilization. Plant and Soil 229(2):177-187.
- Cotswold Seeds. Nitrogen prices make clover the sensible option
- Western Australia Department of Agriculture and Food. Greener Pastures. Nitrogen for intensively grazed dairy pastures
- Montana State University Extension. Factors affecting nitrogen volatilisation
- Manitoba Agriculture. Volatilization Losses From Surface Applied Nitrogen
- Australian Government Grains Research and Development Corporation. Nitrogen volatilisation: Factors affecting how much N is lost and how much is left over time
- University of Minnesota Extension. Understanding nitrogen in soils
- A carbon footprint assessment for pasture-based dairy farming systems in South Africa - 2024-02-07
- What progress have farms participating with Trace & Save made over the past 10 years? - 2023-09-06
- Carbon footprint reduction over time: Lessons from pasture-based dairy farms in South Africa - 2023-09-04

