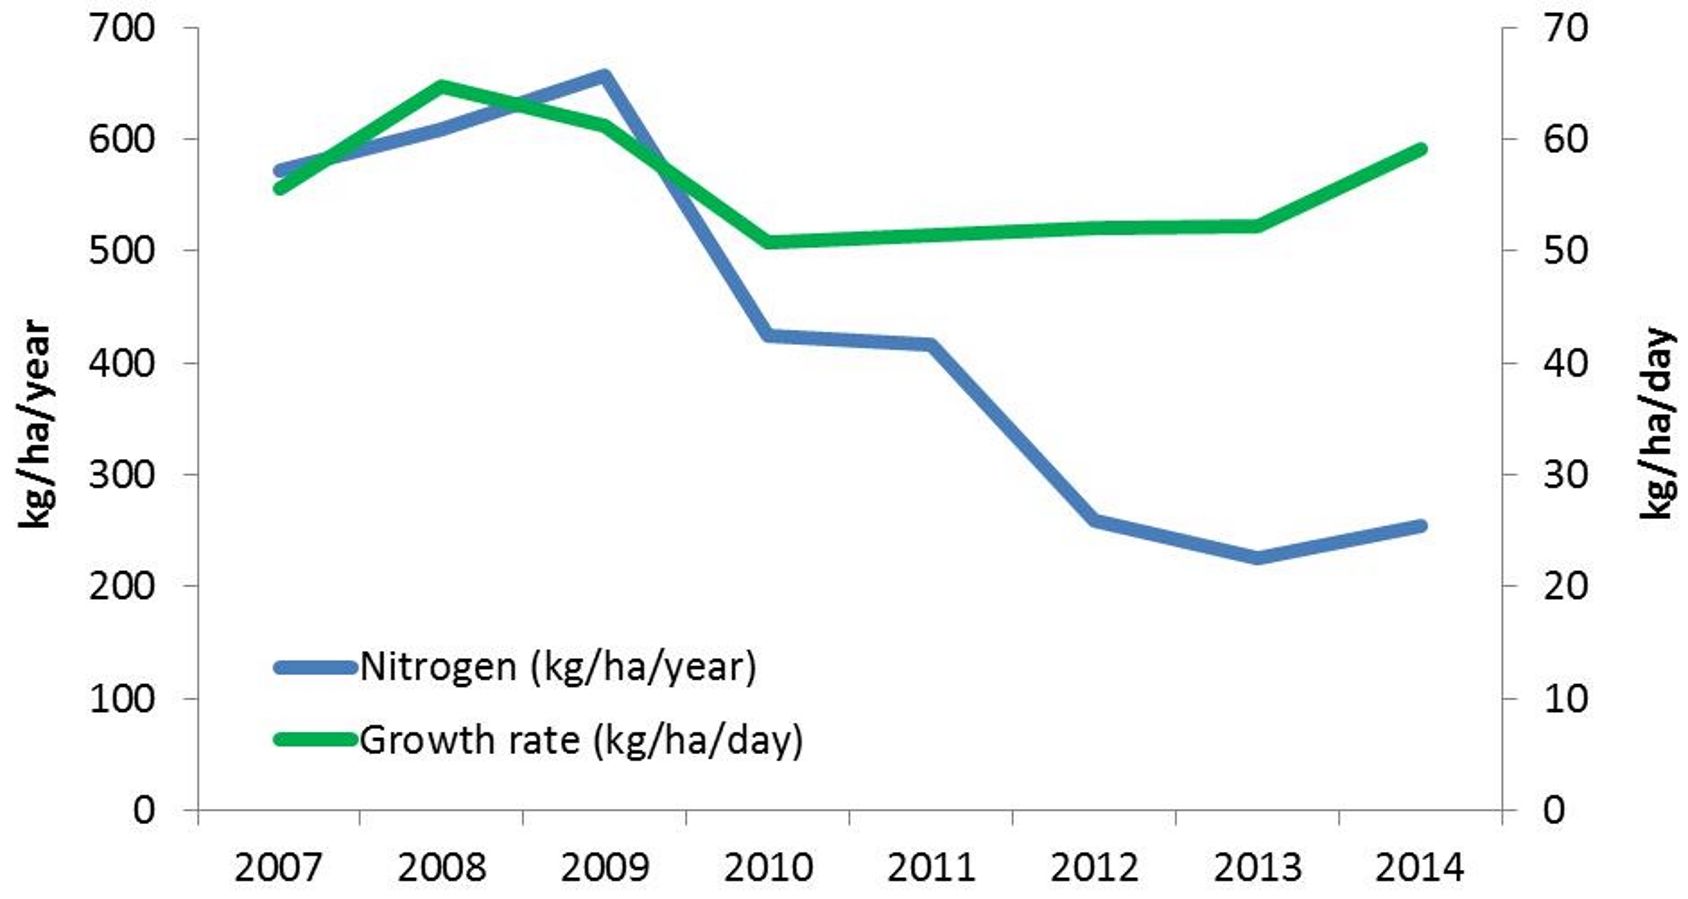
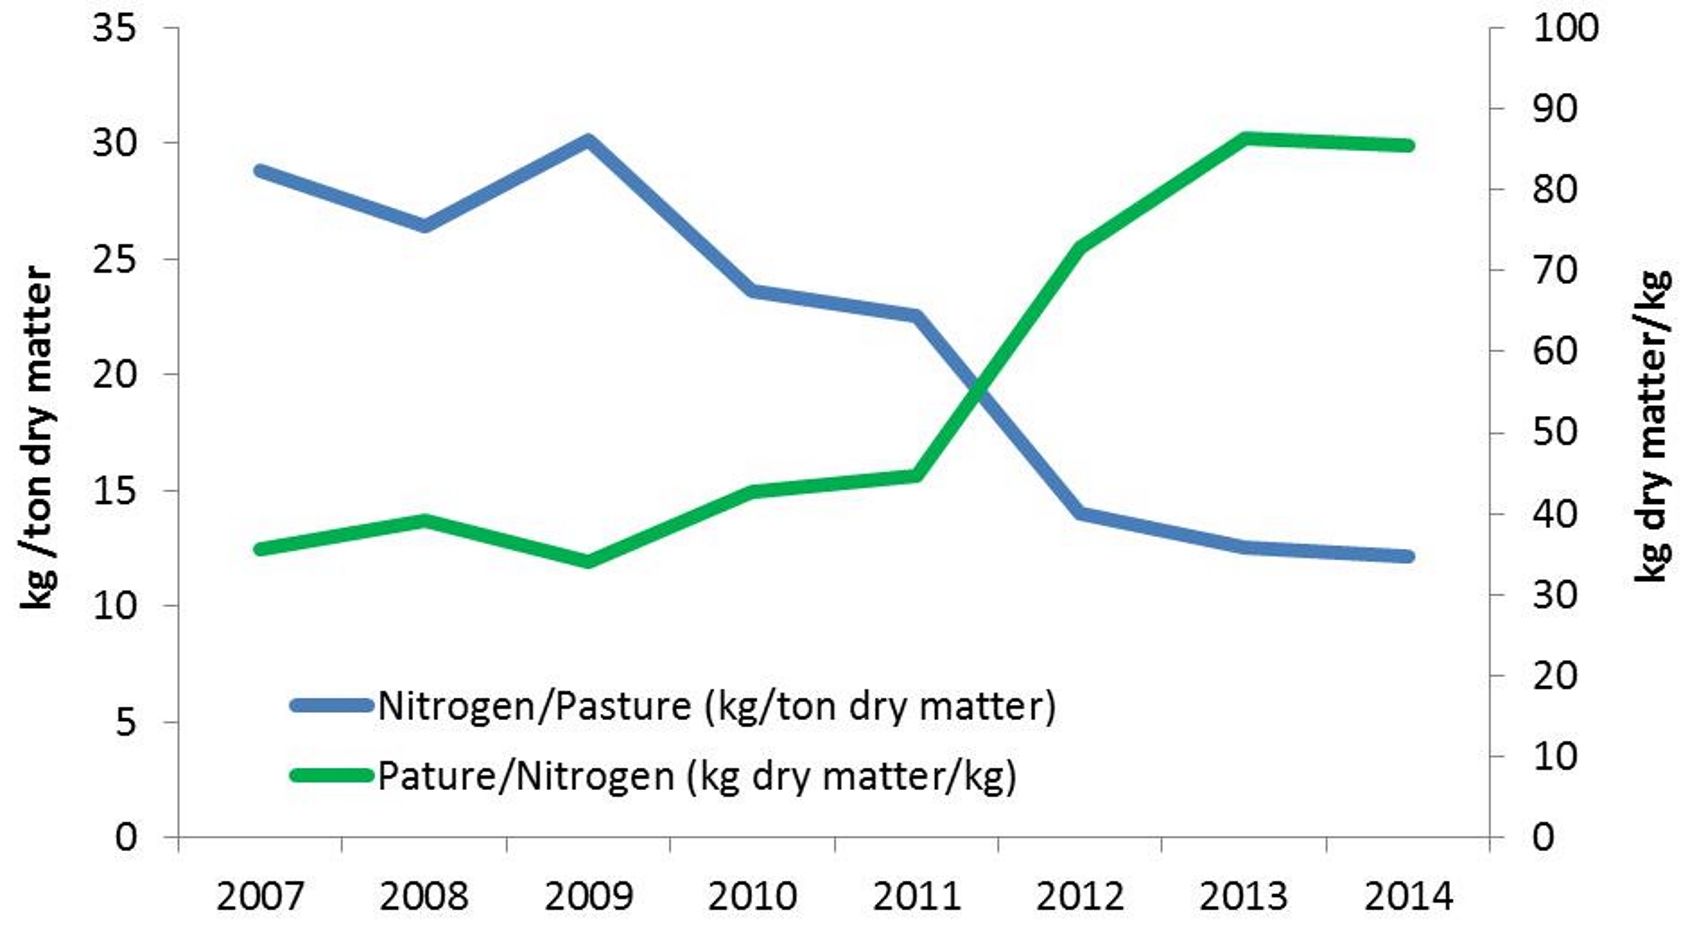
Excessive use of chemical nitrogen fertiliser has a negative effect on soil life and soil structure. Yet there still seems to be a trend of farmers wanting, or feeling the need, to apply excessive (greater than 250kg per hectare per year as a rule of thumb) chemical nitrogen fertiliser to pastures. Previous research we have done has indicated that there are farms in the Tsitsikamma where pasture growth stayed consistent even with a decrease in chemical nitrogen application over a couple of years. It is interesting to note that a similar trend can be observed on a farm in the Oyster Bay region of the Eastern Cape, South Africa. Figure 1 below shows the decrease in nitrogen fertiliser (both organic and inorganic/chemical forms) application, as well as the initial drop, and then increase in pasture growth over the 8 years period. The second figure shows the drastic decrease in the amount of nitrogen fertiliser needed to grow pasture and the huge increase in the amount of pasture grown from each kilogram of nitrogen fertiliser.
Figure 1: Nitrogen applications and pasture growth rates on the farm in Oyster Bay from 2007 until 2014
Figure 2: The relationship between nitrogen application rates and pasture growth on the farm in Oyster Bay from 2007 until 2014
There are great benefits to using low amounts of chemical nitrogen (less than 250 kg per ha per year on irrigated pastures), and higher amounts of organic nitrogen (e.g. compost and chicken litter). The proof of this is shown in the data below from a farm in the Humansdorp area of the Eastern Cape, South Africa for both pasture growth and soil life indicators.
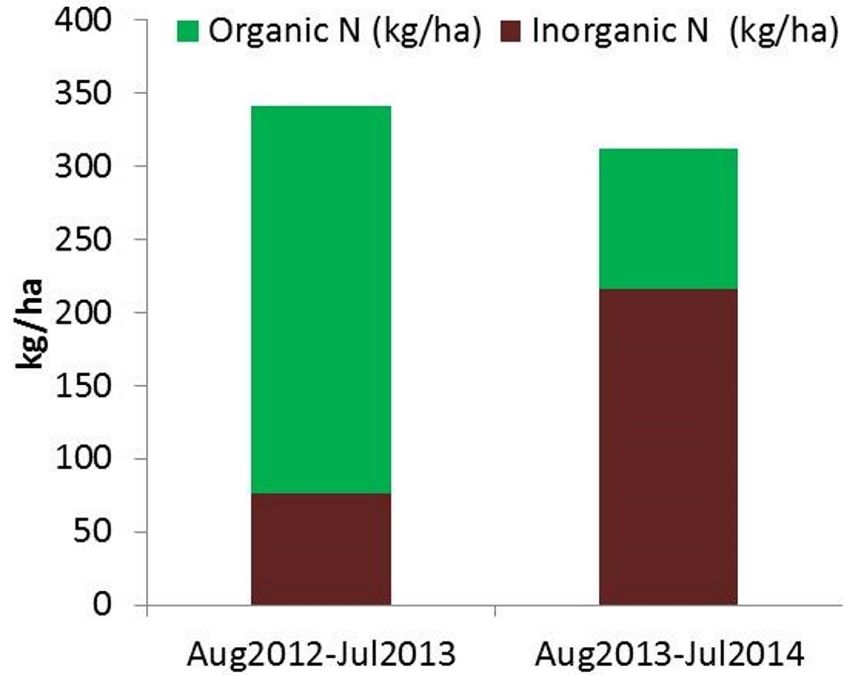
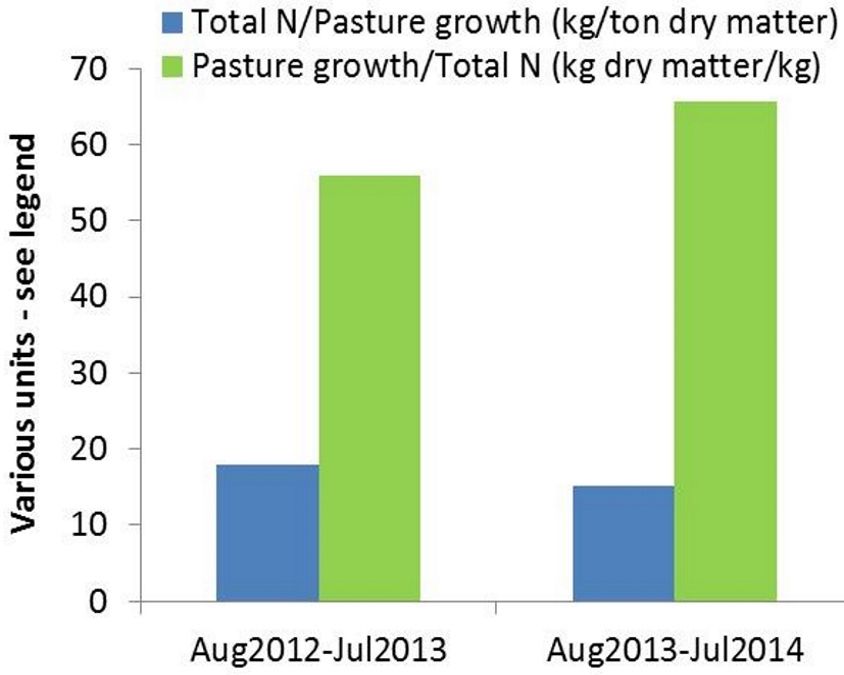
From August 2012 until July 2013 a very large amount of compost and chicken litter were applied on the irrigated pastures, which was the source of the majority of the nitrogen fertiliser applied (Figure 3). From August 2013 until July 2014 there was a lot more chemical nitrogen applied than the previous year, but there was still less than 250kg/ha applied, and compost and chicken litter were still applied (Figure 3). In both years, large amounts of pasture dry matter were grown for each kg of nitrogen which was applied (Figure 4 – these results can be compared to Figure 2 for the other farm used in the case study).
Figure 3: Total (organic and inorganic/chemical) nitrogen fertiliser application on the farm in Humansdorp from August 2012 to July 2014
Figure 4: The relationship between nitrogen application rates and pasture growth on the farm in Humansdorp from August 2012 to July 2014
The soil life indicators on this farm show the benefits of the management practices, which have been mentioned, being implemented, on soil life (Table 1). The average total carbon on the farm is 3.02%, which is well above the ideal on sandy soils of 2.26%. All the soil life indicators are within the ideal parameters for sandy soil. This indicates a healthy and active soil life.
- A carbon footprint assessment for pasture-based dairy farming systems in South Africa - 2024-02-07
- What progress have farms participating with Trace & Save made over the past 10 years? - 2023-09-06
- Carbon footprint reduction over time: Lessons from pasture-based dairy farms in South Africa - 2023-09-04

