Trace & Save has been working with farms since 2012. Eight years down the line gives us a chance to look back at some of the data that we have collected. It means we have a lot of carbon footprints which give us a really good overview of what is happening on the farms we work with.
Climate change is a huge challenge facing society, and dairy farms are often pointed at as the source of a large amount of greenhouse gas emissions. We have written a lot of blogs that challenge this and explain how cows are not necessarily as bad as popular media makes out. Many consumers may be saying, that’s all good and well, but it still doesn’t mean dairy farms shouldn’t reduce their carbon footprints – we agree.
Farm carbon footprints
For this blog I would just like to share a summary of the carbon footprint data from the farms we have worked with over the past eight years. A carbon footprint is a measure of the impact that a farm has on climate change on a yearly basis. The lower the carbon footprint, the less greenhouse gases are being emitted per litre of milk. Thus the lower the negative impact dairy farms are having on climate change.
What does it all mean?
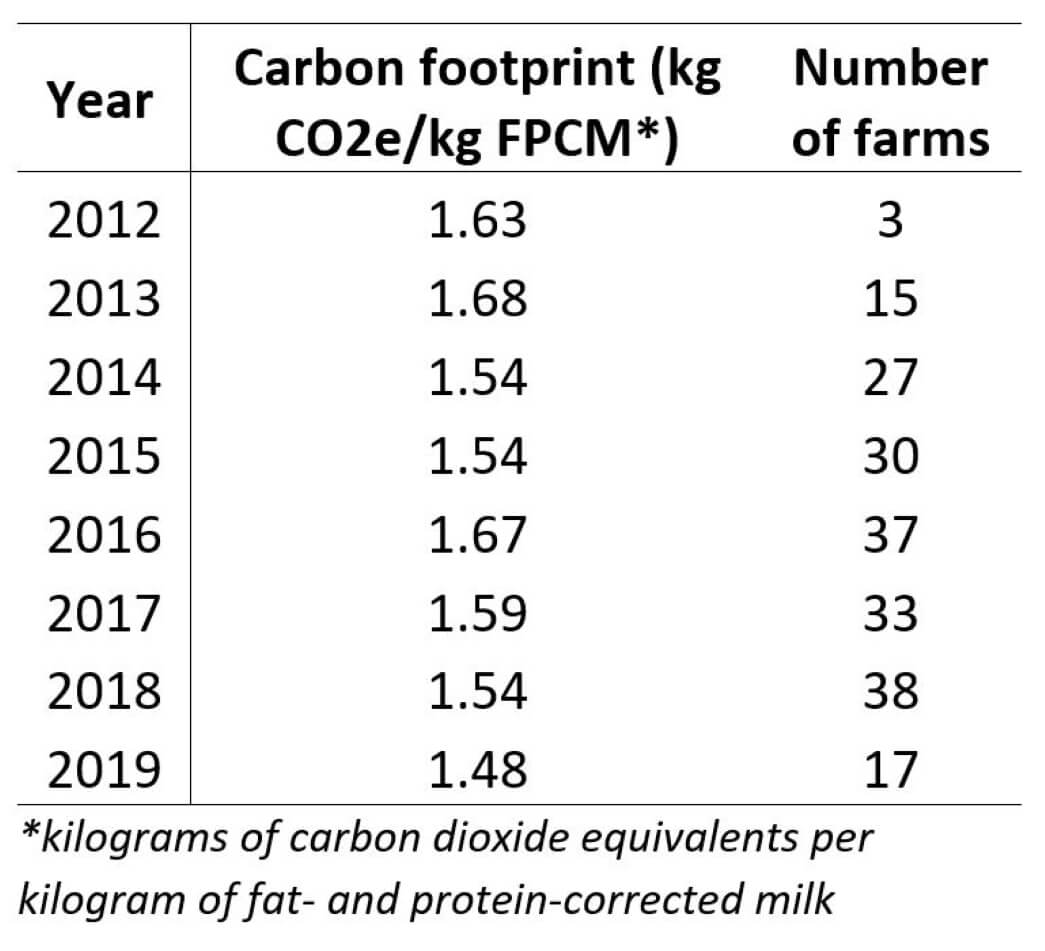
It is encouraging for us to see that the average carbon footprint has reduced over the past eight years. These are not always the exact same farms, as some farms have stopped milk production, or stopped selling milk to Woodlands Dairy (Trace & Save operates the Woodlands Dairy Sustainability Project). So this is not a direct comparison of change on the same farms, but it shows the trend of farms reducing their footprints. This should be celebrated.
It is interesting to note that the average footprints increased in 2016 and 2017. These were difficult years for farmers with regards to the heavy drought that they faced. Since all the farms we work with are pasture-based farms (Green ranging free grazing), they rely heavily on rainfall to ensure the cows have enough food. When there are drought conditions, they are forced to buy in feed. Buying in feed results in a much higher footprint than home-grown feed.
Table 1: Mean carbon footprint per farm over the past eight years from the Trace & Save database
The highest carbon footprint on an individual farm was 3.47 kg CO2e/kg FPCM, which was in 2016. The lowest footprint was from a farm in 2018, 1.09 kg CO2e/kg FPCM. This indicates how big of a range there is. Practices differ from farm-to-farm, so obviously the footprint changes between each farm.
Compared to the global data
Our carbon footprint analysis considers emissions that occur on the farm, as well as emissions that result from feed, fertiliser and other products which farmers buy onto their farms. These off-farm emissions are called Scope 3 emissions. They are often not considered when people quote carbon footprint data. Although we do not technically do a life-cycle assessment, our footprint is most directly comparable to a farm-gate life-cycle assessment. This is where all the emissions associated with milk production, up to the point that the milk leaves a farm, are accounted for.
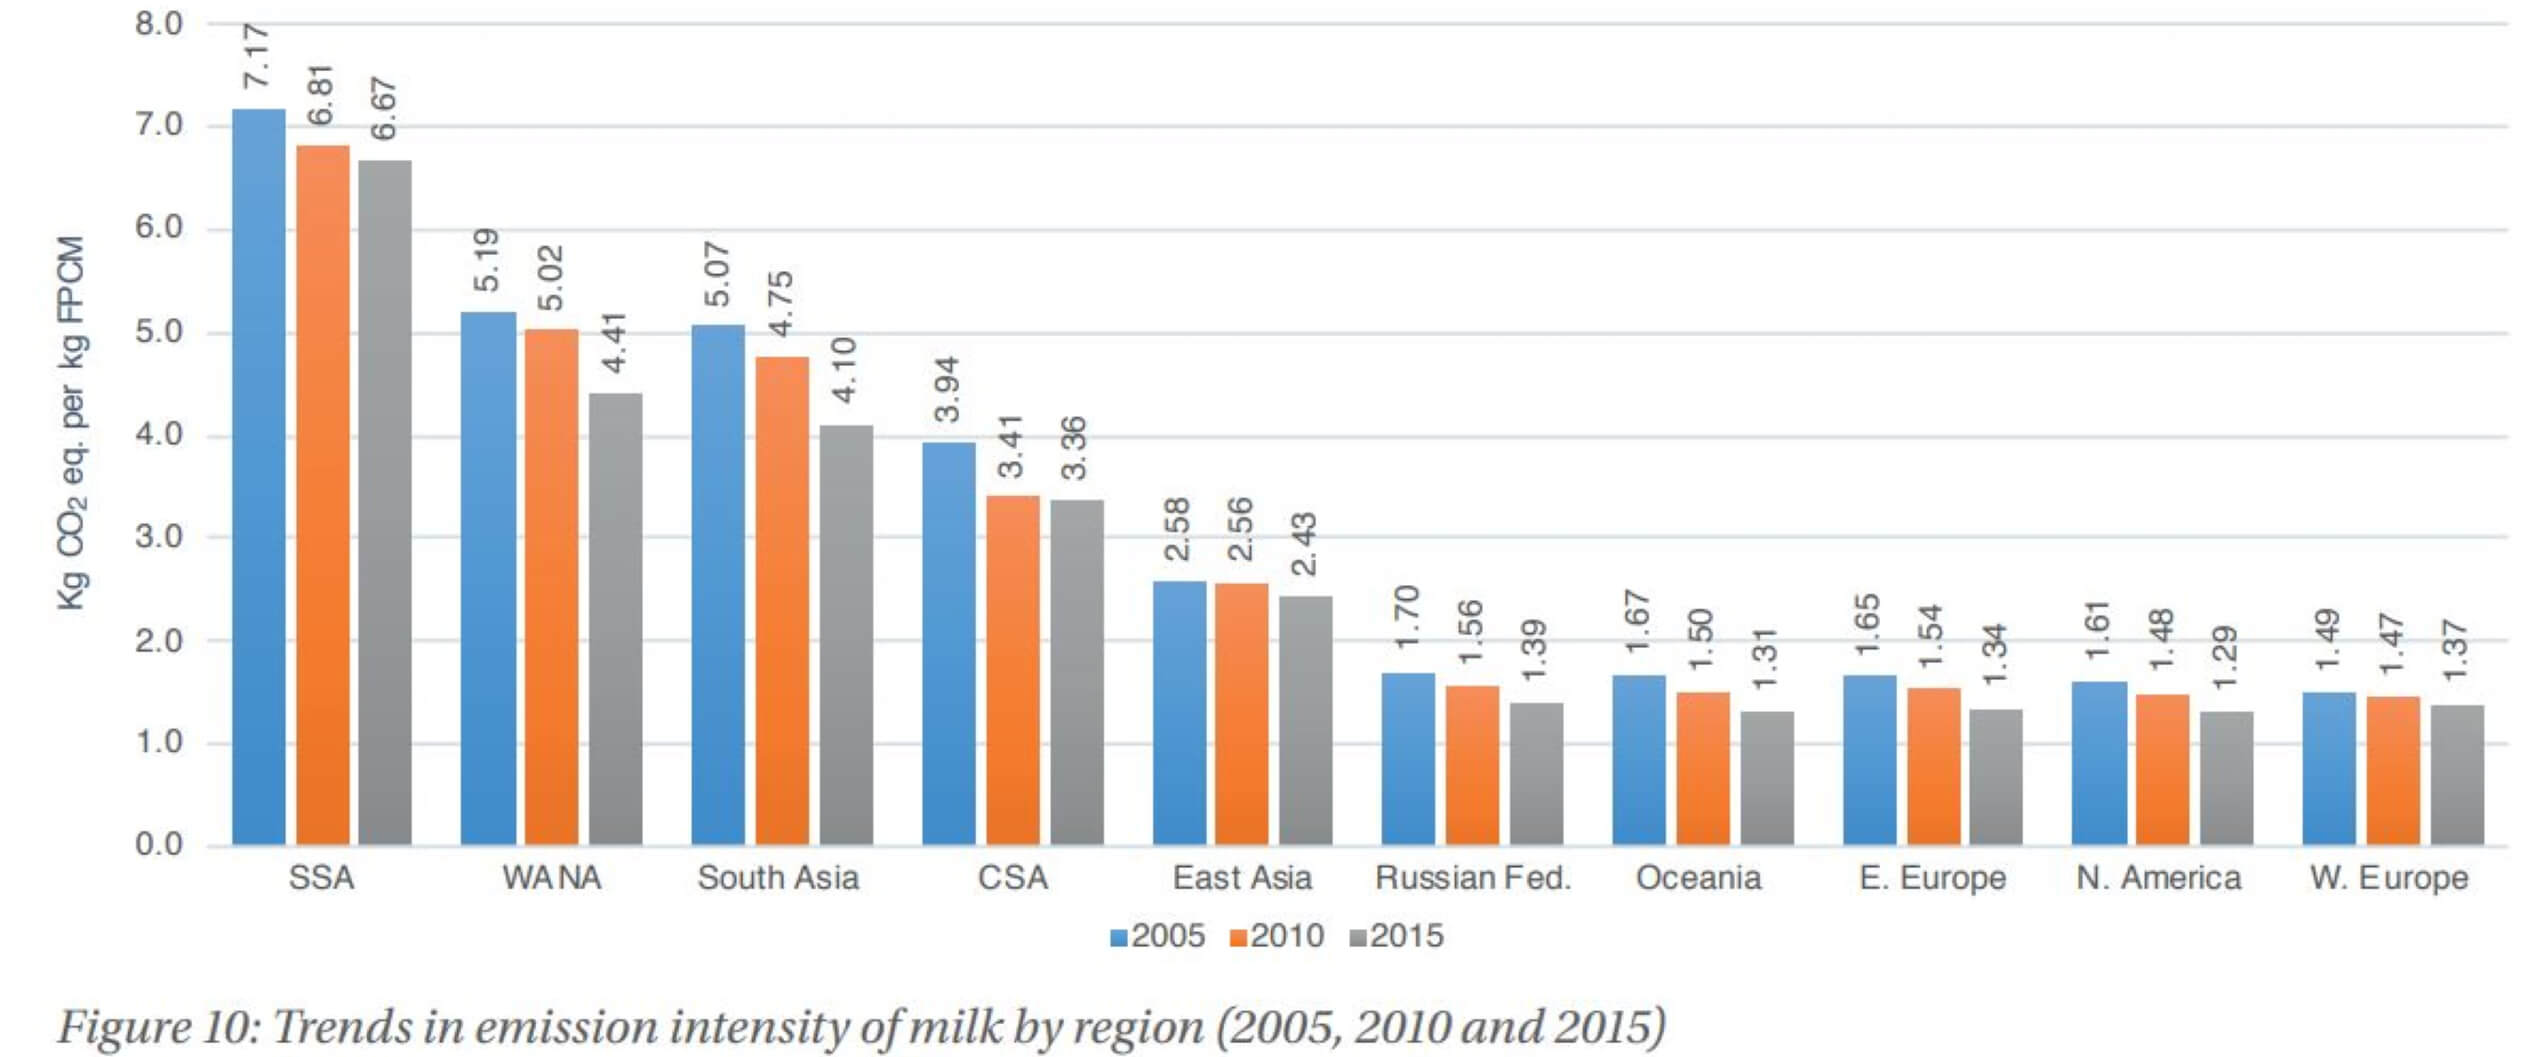
It is interesting to note is that the global average carbon footprint for milk production in 2015 was 2.40 kg CO2e/kg FPCM. The average for Sub-Saharan Africa is even higher at 6.67 kg CO2e/kg FPCM. Our farms fall into this Sub-Saharan Africa category. Not only are our farms emissions well below the global average, they emit less than a quarter of the average emissions per kilogram of milk for Sub-Saharan Africa. Our farms are more comparable to the highly efficient systems of Europe, North America, Australia and New Zealand1.
Long way to go
These results are encouraging, but there is still a long way to go. I always tell farmers that the first threshold we need to get below is 1.4 kg CO2e/kg FPCM. I think this is achievable for all the farmers we work with. The next big goal is for the most progressive farmers to get below 1.0 kg CO2e/kg FPCM. It is not only important to reduce emissions though. It is also important to focus on building soil carbon, which is the positive role that farms can play.
There are a lot of mis-communicated facts, and badly reported science out there. One of Trace & Save’s goals is to show consumers measurable evidence of how farmers are improving their practices and becoming more sustainable. Our farmers are not perfect. There is lots of room for improvement. But they are getting better, and constantly looking for opportunities to improve. I believe these farmers should be supported, rather than be ostracised and painted as terrible towards the environment.
Source
- FAO and GDP. 2018. Climate change and the global dairy cattle sector – The role of the dairy sector in a low-carbon future. Rome. 36 pp. Licence: CC BY-NC-SA- 3.0 IGO. (https://dairysustainabilityframework.org/wp-content/uploads/2019/01/Climate-Change-and-the-Global-Dairy-Cattle-Sector.pdf – Accessed 16 December 2019)
- A carbon footprint assessment for pasture-based dairy farming systems in South Africa - 2024-02-07
- What progress have farms participating with Trace & Save made over the past 10 years? - 2023-09-06
- Carbon footprint reduction over time: Lessons from pasture-based dairy farms in South Africa - 2023-09-04


