Introduction
I find myself in conversations about net carbon emissions more and more often. People have heard that carbon can be stored in the soil on pasture-based dairy farms. Alternatively, dairy farms are pointed to as some of the worst culprits of greenhouse gas emissions. So if farms can have a positive impact, but are also a source of negative impact, what is the net effect? I am asked this question often because people know that Trace & Save measures these things. We do soil health testing, which includes testing for soil carbon, each year. We also assess the carbon footprint on farms each year. This puts us in the unique position to discuss real data on this topic.
Previous analysis
I wrote a blog (Putting sustainable farming theory into practice) about this topic in September 2017. In that blog I showed the difference between greenhouse gas emissions and carbon stored in the soil on 19 farms. There was one farm which had stored more carbon than what they had emitted.
Most recent available data
I decided to update this analysis. Not only to provide an answer to those interested, but also because I had the feeling that we might have a lot more farms which are closer to a net positive impact. In other words, they are showing evidence of storing more carbon in the soil than what they have emitted as greenhouse gases.
The data included in this assessment are from 45 pasture-based dairy farms in South Africa. Thirteen of the farms are in the Tsitsikamma, ten in Alexandria, seven in Oyster Bay, six in Cradock, two near Gamtoos River mouth and one each in Cookhouse, George, Hogsback and Kareedouw.
Analysis
Soil carbon storage
I used the average (mean) soil carbon (LECO Total carbon analysis) data from composite samples. These samples are taken across the entire farm at a depth of 0-15cm. I choose the average soil carbon from composites as this is a robust indication of the situation on each farm. There are between 20 and 150 composite samples taken per farm. Each of these samples is made up of at least 10 samples from 10 different spots in a camp. This results in a robust mean.
I compared the average soil carbon levels when we first took samples on each farm with the most recent soil results. There was a mean of 3.6 years (range: 1-6 years) and median of 4 years between the earliest and most recent soil samples.
The difference between the average carbon from the earliest and most recent soil carbon results was divided by the years between when those samples were taken. This gives a yearly change in soil carbon.
- Formula: soil carbon change [%] = (current total carbon [%] – baseline total carbon [%]) / (year of current sample – year of baseline sample)
Soil carbon change was then converted to change in tons of carbon per hectare in the top 15cm of soil. I used a standardised bulk density of 1.3 g/cm3.
- Formula: soil carbon change [tons/ha/year] = soil carbon change [%] x bulk density [1.3 g/cm3] x depth [15 cm]
Finally this figure was converted to tons of carbon dioxide equivalents (CO2e) stored or lost from the soil per hectare per year.
- Formula: soil carbon change [tons CO2e/ha/year] = soil carbon change [tons/ha/year] x (atomic mass of carbon dioxide [44 g/mol] / atomic mass of carbon [12 g/mol])
A point to note: I am not calling this change carbon sequestration. That is a technical term which carries certain connotations about how it needs to be calculated. For example, most people say there needs to be at least 10 years between soil samples to claim stable carbon sequestration. I am more interested in the trend that can be observed on these farms. That is why I am looking at the change in soil carbon based on the data we have available.
Greenhouse gas emissions
Trace & Save does a yearly carbon footprint assessment of each farm. This footprint calculates the amount of greenhouse gas emissions (measured in CO2e) resulting from farming practices. There was a mean of 3.4 (range: 1-7) and median of 3 carbon footprint assessments for each farm included in this study.
I use the average greenhouse gas emissions per year (tons CO2e) per farm, and then divided this by the area (hectares) of the farm. This gave me a greenhouse gas emission figure per hectare per year (tons CO2e/ha/year).
Net carbon emissions
Since I have soil carbon change and greenhouse gas emissions in the same unit, I can now make a direct comparison between them. Greenhouse gases count as a positive contribution to net carbon emissions. A decrease (negative value for tons CO2e/ha/year) in soil carbon is also a positive contribution to net carbon emissions. An increase (positive value for tons CO2e/ha/year) in soil carbon is a negative contribution to net carbon emissions. I have therefore multiplied soil carbon change by -1 to get a soil carbon emissions figure.
Therefore, in order to calculate net emissions I add the soil and greenhouse gas emissions.
- Formula: net carbon emissions [tons CO2e/ha/year] = GHG emissions [tons CO2e/ha/year] + soil carbon emissions [tons CO2e/ha/year]
Results
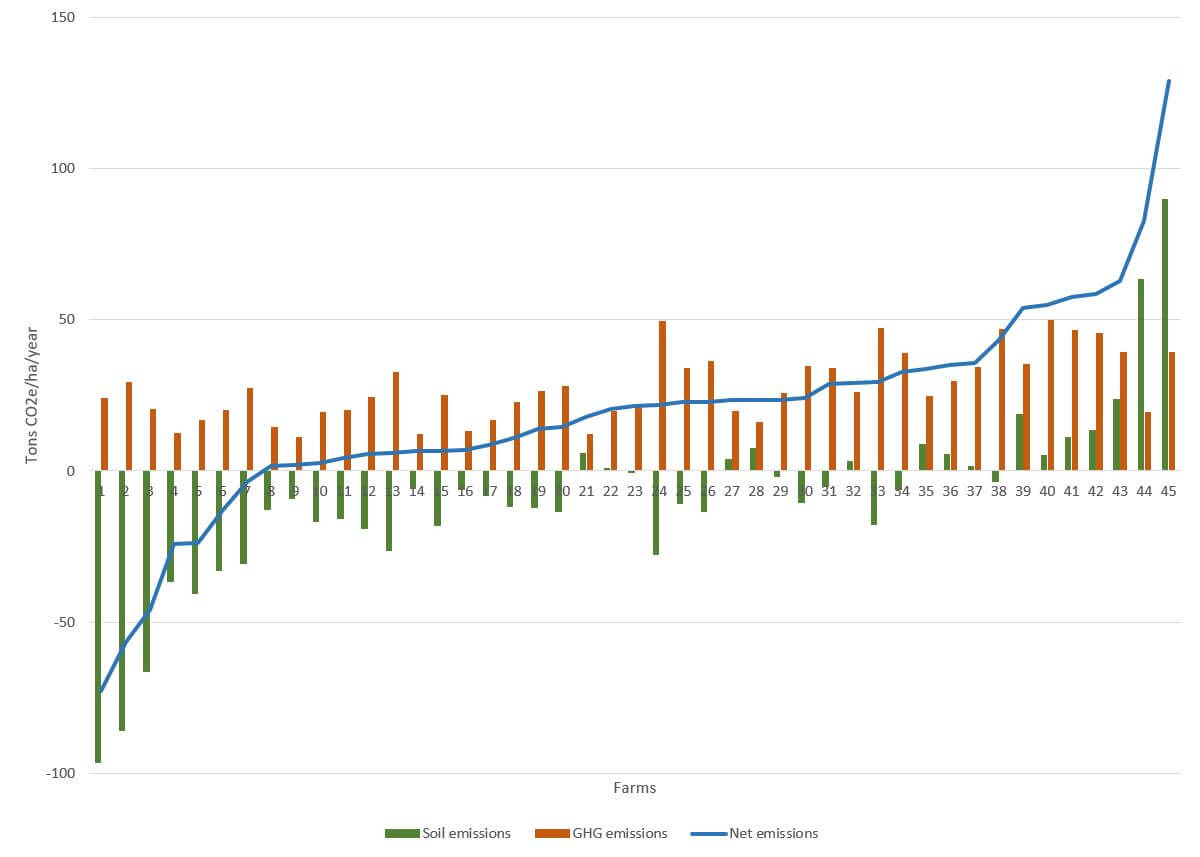
The average trend of all 45 farms’ results is an increase in soil carbon of 8.9 tons CO2e/ha/year and greenhouse gas emissions of 27.5 tons CO2e/ha/year. This indicates a net carbon emission of 18.6 tons CO2e/ha/year. This means the reality of these 45 pasture-based dairy farms is that their net negative effect is 68% of what is generally understood and discussed.
The results per farm are shown in the graph below. There are seven farms which have negative net carbon emissions for the duration of this study. That is amazing! It completely changes the narrative of the negative impact of dairy farming. The indication is that these farms are having a net positive effect when considering the impact of agriculture on climate change.
Figure 1: Net carbon emissions from 45 pasture-based dairy farms
Obviously, there is still the problem of the other 38 farms. But of these farms, only 15 of them are not making the positive contribution of increasing soil carbon. It is Trace & Save’s mission to help these farmers reverse this trend, and all these farmers are committed to doing so. That is why they work with us. It is mostly circumstances (such as drought) that have led to this trend.
This assessment considers the full currently perceived impact of dairy cows on climate change. This negative impact might not even be as big as people think, which creates the possibility of even more farms with net negative carbon emissions. Read more about why I say this: Are cows really that bad?
Conclusion
We are very excited and encouraged by these results. Excitement because the farmers we work with are committed to farming in a way that reverses the negative impacts that agriculture has historically had on the environment. Encouraged to see that the theory that regenerative practices can have this positive impact is a reality.
The opportunity and challenge going forward is to help the farmers we work with continue building their soil carbon and reducing their greenhouse gas emissions, so more and more farmers can have a net positive impact.


